
US Workplace Injury Statistics — Original RemoteLaws analysis of official data — Updated November 21, 2026
Workplace Injury Statistics 2026-2027: 2.41 Million Cases, Safest and Riskiest States
Private employers reported 2,414,200 nonfatal workplace injuries and illnesses in 2025, one about every 13 seconds, at a rate of 2.3 per 100 workers. 5,070 workers died from work injuries in 2024. This page goes beyond the BLS release with the RemoteLaws Workplace Risk Index for every state, fatal injury rankings, industry risk multiples and free charts and CSV files to cite.

By the RemoteLaws Research Team · Published November 21, 2026 · Latest data: Calendar year 2025 nonfatal (BLS SOII, released November 18, 2026); 2024 fatal (CFOI) · Next update: 2027 (2025 fatal data postponed; detailed 2025-2026 case data)
Key Workplace Injury Statistics 2026-2027 (Latest Data and RemoteLaws Indices)
- A private-sector worker in the US was hurt or made ill on the job about every 13 seconds in 2025, and a worker died from a work injury about every 104 minutes in 2024. Computed by RemoteLaws from BLS SOII 2025 (2,414,200 cases) and CFOI 2024 (5,070 deaths)
- RemoteLaws Workplace Risk Index: Wyoming ranked as the riskiest state for workers (269, U.S. = 100), followed by Alaska (168) and Montana (155); the District of Columbia scored lowest (72). Computed by RemoteLaws from BLS SOII state rates, private industry, 2025 and BLS CFOI fatal injury rates by state, 2007-2024
- Wyoming had the highest fatal work injury rate in 2024, 13.9 per 100,000 workers, 4.2 times the U.S. rate of 3.3; Rhode Island had the lowest (1.1). BLS CFOI (source); ratio Computed by RemoteLaws
- Transportation and warehousing workers were injured at 1.9 times the private-industry rate in 2025; finance and insurance workers at about one-eighth of it (0.3 vs 2.3). Computed by RemoteLaws from BLS SOII Table 2 (source)
- Private employers reported 2,414,200 nonfatal workplace injuries and illnesses in 2025, down 3.0% from 2,488,400 in 2024. BLS SOII, calendar 2025, released November 18, 2026 (source)
- The rate was 2.3 cases per 100 full-time workers in 2025, unchanged from 2024. BLS SOII, 2025 (source)
- Injuries made up 2,304,800 cases; illnesses fell 26.1% to 109,400, led by respiratory illnesses (17,500, down from 54,000). BLS SOII, 2025 (source)
- 842,500 cases involved days away from work (0.8 per 100 workers) and 558,300 involved job transfer or restriction. BLS SOII, 2025 (source)
- Transportation and warehousing had the highest rate, 4.4 per 100 workers; health care and social assistance had the most cases, 535,500. BLS SOII Table 2, 2025 (source)
- Reported cases fell 15.5% between 2016 (2,857,400) and 2025. Computed by RemoteLaws from BLS SOII Table 1, 2016-2025 (source)
- Separately, US workers’ compensation programs paid $64.1 billion in medical and cash benefits in 2023, more than 47% of it for medical care. National Academy of Social Insurance, 2023 data, published August 11, 2026 (source)
Each line can be quoted as written. Please link to this page and keep the source and period. Lines marked Computed by RemoteLaws are original RemoteLaws calculations from official data. The NASI line comes from a different source, year and population (see the methodology).
Safest and Riskiest States for Workers: the RemoteLaws Workplace Risk Index
BLS publishes nonfatal injury rates and fatal injury rates separately. The RemoteLaws Workplace Risk Index puts them side by side: each state’s 2025 nonfatal rate is divided by the U.S. rate (2.3), its 2024 fatal rate by the U.S. rate (3.3), and the two ratios are averaged and multiplied by 100. A score of 150 means the state’s workers face, on average, 50% more injury risk than the national average across both measures.
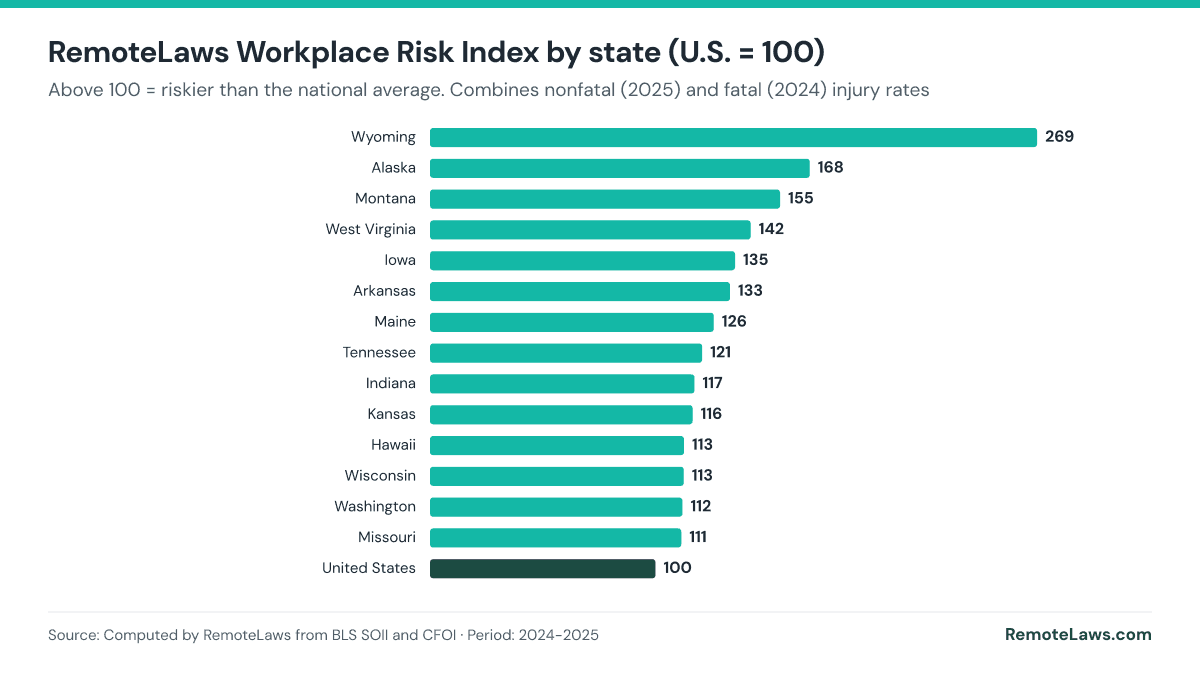
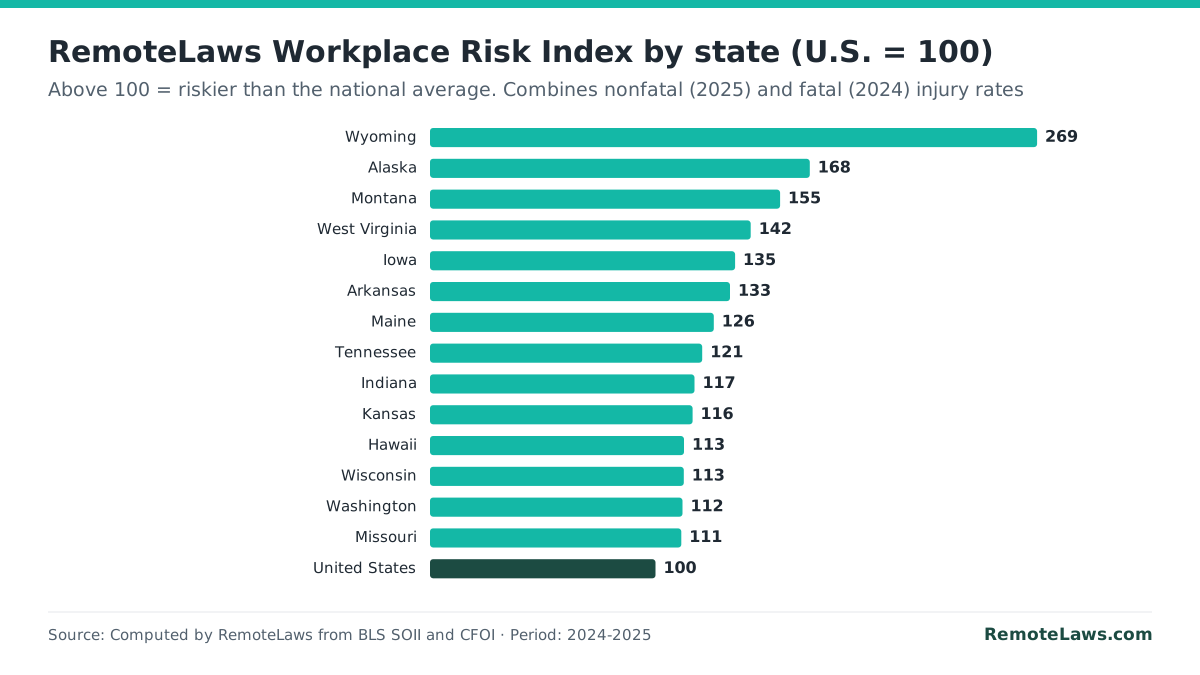
Cite this chart (APA, MLA, HTML) and embed code
APA: RemoteLaws. (2026, November 21). RemoteLaws Workplace Risk Index by state (U.S. = 100) [Chart]. Data from Computed by RemoteLaws from BLS SOII (2025) and CFOI (2024). https://remotelaws.com/statistics/workplace-injuries/
MLA: “RemoteLaws Workplace Risk Index by state (U.S. = 100).” RemoteLaws, 21 Nov. 2026, https://remotelaws.com/statistics/workplace-injuries/. Chart; data from Computed by RemoteLaws from BLS SOII (2025) and CFOI (2024).
HTML link with attribution:
Embed this chart:
| Rank | State | Risk Index | Nonfatal rate 2025 (per 100) | DART rate 2025 (per 100) | Fatal rate 2024 (per 100,000) |
|---|---|---|---|---|---|
| 1 | Wyoming | 269 | 2.7 | 1.3 | 13.9 |
| 2 | Alaska | 168 | 2.8 | 1.6 | 7.1 |
| 3 | Montana | 155 | 3.1 | 1.6 | 5.8 |
| 4 | West Virginia | 142 | 2.5 | 1.3 | 5.8 |
| 5 | Iowa | 135 | 2.6 | 1.5 | 5.2 |
| 6 | Arkansas | 133 | 1.8 | 0.9 | 6.2 |
| 7 | Maine | 126 | 3.7 | 2.4 | 3.0 |
| 8 | Tennessee | 121 | 2.0 | 1.1 | 5.1 |
| 9 | Indiana | 117 | 2.4 | 1.3 | 4.3 |
| 10 | Kansas | 116 | 2.5 | 1.4 | 4.1 |
| 11 | Hawaii | 113 | 3.3 | 2.0 | 2.7 |
| 12 | Wisconsin | 113 | 2.6 | 1.4 | 3.7 |
| 13 | Washington | 112 | 3.2 | 2.0 | 2.8 |
| 14 | Missouri | 111 | 2.2 | 1.2 | 4.2 |
| 15 | Oregon | 111 | 3.3 | 2.0 | 2.6 |
| 16 | Kentucky | 110 | 2.5 | 1.3 | 3.7 |
| 17 | Colorado | 109 | 2.8 | 1.5 | 3.2 |
| 18 | Utah | 108 | 2.4 | 1.1 | 3.7 |
| 19 | Oklahoma | 108 | 2.1 | 1.2 | 4.1 |
| 20 | Louisiana | 106 | 1.3 | 0.7 | 5.1 |
| 21 | South Carolina | 105 | 1.7 | 1.0 | 4.5 |
| 22 | Vermont | 105 | 3.3 | 1.7 | 2.2 |
| 23 | Maryland | 105 | 2.6 | 1.5 | 3.2 |
| 24 | North Carolina | 103 | 1.9 | 1.0 | 4.1 |
| 25 | Minnesota | 103 | 2.7 | 1.4 | 2.9 |
| 26 | Nevada | 102 | 3.1 | 1.9 | 2.3 |
| 27 | Pennsylvania | 101 | 2.5 | 1.4 | 3.1 |
| 28 | Michigan | 100 | 2.3 | 1.3 | 3.3 |
| 29 | New Mexico | 98 | 2.0 | 1.0 | 3.6 |
| 30 | Texas | 96 | 1.7 | 1.1 | 3.9 |
| 31 | Nebraska | 96 | 2.6 | 1.4 | 2.6 |
| 32 | California | 95 | 2.7 | 1.7 | 2.4 |
| 33 | Arizona | 95 | 2.4 | 1.4 | 2.8 |
| 34 | Alabama | 94 | 1.8 | 1.0 | 3.6 |
| 35 | Connecticut | 91 | 2.6 | 1.6 | 2.3 |
| 36 | Ohio | 90 | 1.9 | 1.1 | 3.2 |
| 37 | Virginia | 90 | 1.9 | 1.1 | 3.2 |
| 38 | Illinois | 87 | 2.1 | 1.4 | 2.7 |
| 39 | Massachusetts | 80 | 2.2 | 1.3 | 2.1 |
| 40 | New York | 75 | 1.8 | 1.0 | 2.4 |
| 41 | New Jersey | 74 | 2.1 | 1.3 | 1.9 |
| 42 | Delaware | 74 | 2.0 | 1.2 | 2.0 |
| 43 | District of Columbia | 72 | 1.2 | 0.6 | 3.0 |
Sources: BLS SOII state rates, private industry, 2025, BLS SOII state DART rates, 2025, BLS CFOI fatal injury rates by state, 2007-2024. Index computed by RemoteLaws. BLS publishes state nonfatal estimates for 42 states and DC only, so Florida, Georgia, Idaho, Mississippi, New Hampshire, North Dakota, Rhode Island and South Dakota are not ranked here (their fatal rates are in the next table). DART = cases with days away from work, job restriction or transfer. State links go to each state’s employment law guide.
Fatal Work Injuries by State (2024)


Cite this chart (APA, MLA, HTML) and embed code
APA: RemoteLaws. (2026, November 21). Fatal work injury rate by state, 2024 [Chart]. Data from U.S. Bureau of Labor Statistics, CFOI. https://remotelaws.com/statistics/workplace-injuries/
MLA: “Fatal work injury rate by state, 2024.” RemoteLaws, 21 Nov. 2026, https://remotelaws.com/statistics/workplace-injuries/. Chart; data from U.S. Bureau of Labor Statistics, CFOI.
HTML link with attribution:
Embed this chart:
| Rank | State | Rate 2024 | Rate 2019 | Change since 2019 | Times the U.S. rate |
|---|---|---|---|---|---|
| 1 | Wyoming | 13.9 | 12.0 | +1.9 | 4.2× |
| 2 | Mississippi | 8.0 | 5.2 | +2.8 | 2.4× |
| 3 | Alaska | 7.1 | 14.1 | -7.0 | 2.2× |
| 4 | North Dakota | 6.8 | 9.7 | -2.9 | 2.1× |
| 5 | Arkansas | 6.2 | 5.0 | +1.2 | 1.9× |
| 6 | Montana | 5.8 | 7.8 | -2.0 | 1.8× |
| 7 | South Dakota | 5.8 | 4.7 | +1.1 | 1.8× |
| 8 | West Virginia | 5.8 | 6.4 | -0.6 | 1.8× |
| 9 | Iowa | 5.2 | 4.7 | +0.5 | 1.6× |
| 10 | Louisiana | 5.1 | 6.2 | -1.1 | 1.5× |
| 11 | Tennessee | 5.1 | 4.0 | +1.1 | 1.5× |
| 12 | Idaho | 5.0 | 4.1 | +0.9 | 1.5× |
| 13 | South Carolina | 4.5 | 4.8 | -0.3 | 1.4× |
| 14 | Indiana | 4.3 | 4.7 | -0.4 | 1.3× |
| 15 | Missouri | 4.2 | 3.7 | +0.5 | 1.3× |
| 16 | Kansas | 4.1 | 6.0 | -1.9 | 1.2× |
| 17 | North Carolina | 4.1 | 4.0 | +0.1 | 1.2× |
| 18 | Oklahoma | 4.1 | 4.2 | -0.1 | 1.2× |
| 19 | Texas | 3.9 | 4.7 | -0.8 | 1.2× |
| 20 | Kentucky | 3.7 | 4.2 | -0.5 | 1.1× |
| 21 | Utah | 3.7 | 3.5 | +0.2 | 1.1× |
| 22 | Wisconsin | 3.7 | 3.8 | -0.1 | 1.1× |
| 23 | Alabama | 3.6 | 4.2 | -0.6 | 1.1× |
| 24 | New Mexico | 3.6 | 6.2 | -2.6 | 1.1× |
| 25 | Georgia | 3.4 | 4.3 | -0.9 | 1.0× |
| 26 | Michigan | 3.3 | 3.6 | -0.3 | 1.0× |
| 27 | Colorado | 3.2 | 2.9 | +0.3 | 1.0× |
| 28 | Maryland | 3.2 | 2.6 | +0.6 | 1.0× |
| 29 | Ohio | 3.2 | 3.1 | +0.1 | 1.0× |
| 30 | Virginia | 3.2 | 4.3 | -1.1 | 1.0× |
| 31 | Pennsylvania | 3.1 | 2.6 | +0.5 | 0.9× |
| 32 | District of Columbia | 3.0 | 2.5 | +0.5 | 0.9× |
| 33 | Maine | 3.0 | 3.0 | +0.0 | 0.9× |
| 34 | Florida | 2.9 | 3.2 | -0.3 | 0.9× |
| 35 | Minnesota | 2.9 | 2.6 | +0.3 | 0.9× |
| 36 | Arizona | 2.8 | 2.7 | +0.1 | 0.8× |
| 37 | Washington | 2.8 | 2.3 | +0.5 | 0.8× |
| 38 | Hawaii | 2.7 | 4.1 | -1.4 | 0.8× |
| 39 | Illinois | 2.7 | 2.7 | +0.0 | 0.8× |
| 40 | Nebraska | 2.6 | 5.4 | -2.8 | 0.8× |
| 41 | Oregon | 2.6 | 3.5 | -0.9 | 0.8× |
| 42 | California | 2.4 | 2.5 | -0.1 | 0.7× |
| 43 | New York | 2.4 | 3.1 | -0.7 | 0.7× |
| 44 | Connecticut | 2.3 | 1.4 | +0.9 | 0.7× |
| 45 | Nevada | 2.3 | 2.8 | -0.5 | 0.7× |
| 46 | Vermont | 2.2 | 3.2 | -1.0 | 0.7× |
| 47 | Massachusetts | 2.1 | 2.4 | -0.3 | 0.6× |
| 48 | Delaware | 2.0 | 4.1 | -2.1 | 0.6× |
| 49 | New Jersey | 1.9 | 1.8 | +0.1 | 0.6× |
| 50 | New Hampshire | 1.7 | 1.5 | +0.2 | 0.5× |
| 51 | Rhode Island | 1.1 | 1.8 | -0.7 | 0.3× |
Source: BLS CFOI fatal injury rates by state, 2007-2024. Changes and multiples computed by RemoteLaws. The rate fell between 2019 and 2024 in 28 of 51 states (Computed by RemoteLaws). BLS postponed the 2025 fatal injury release originally scheduled for December 16, 2026.
Workplace Injuries Over Time: 2016 to 2025
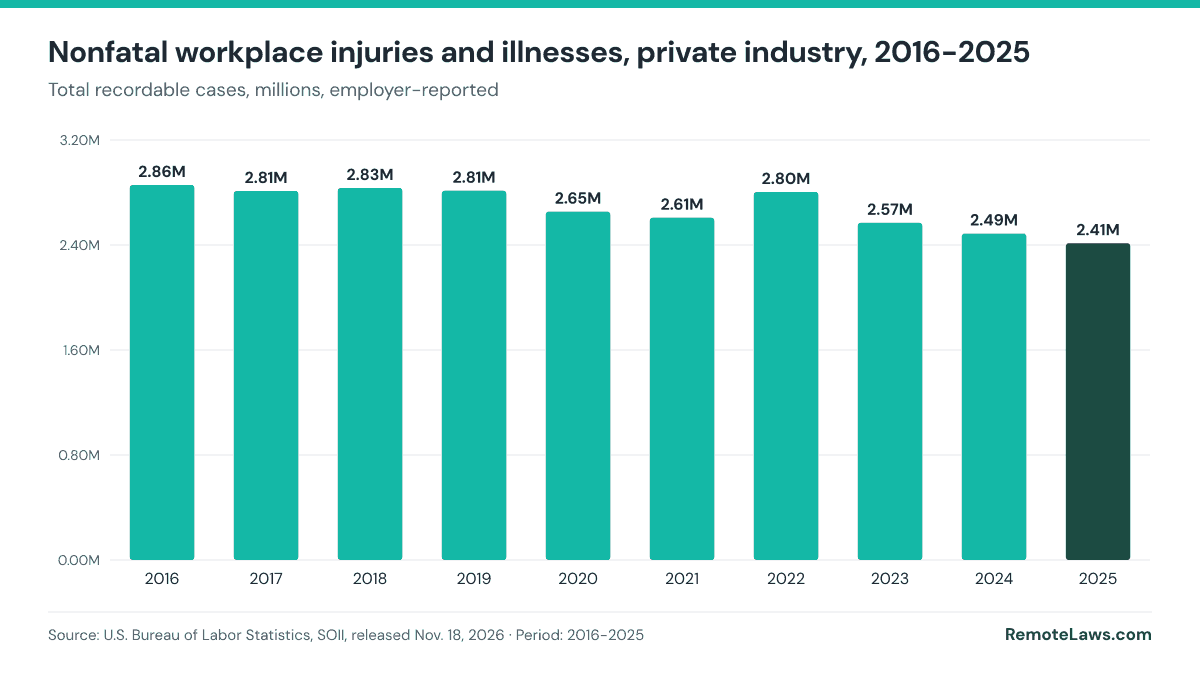
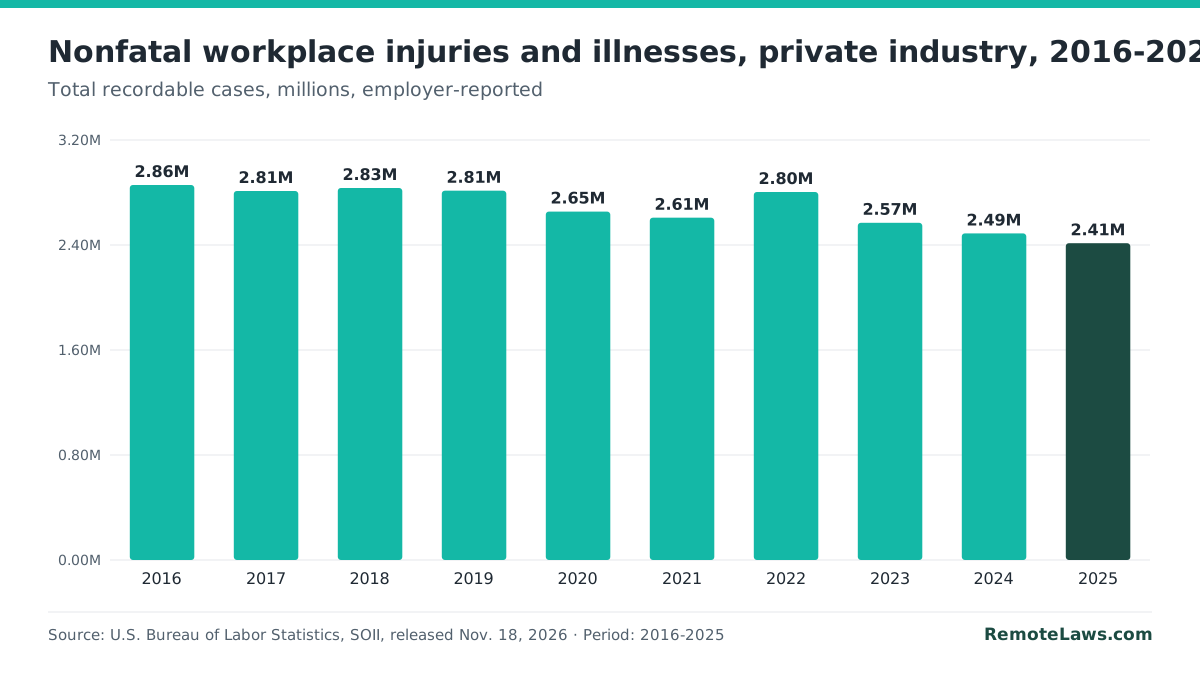
Cite this chart (APA, MLA, HTML) and embed code
APA: RemoteLaws. (2026, November 21). Nonfatal workplace injuries and illnesses, private industry, 2016-2025 [Chart]. Data from U.S. Bureau of Labor Statistics, SOII (Nov. 18, 2026 release). https://remotelaws.com/statistics/workplace-injuries/
MLA: “Nonfatal workplace injuries and illnesses, private industry, 2016-2025.” RemoteLaws, 21 Nov. 2026, https://remotelaws.com/statistics/workplace-injuries/. Chart; data from U.S. Bureau of Labor Statistics, SOII (Nov. 18, 2026 release).
HTML link with attribution:
Embed this chart:
| Year | Cases | Change from prior year |
|---|---|---|
| 2016 | 2,857.4 | |
| 2017 | 2,811.5 | -1.6% (Computed by RemoteLaws) |
| 2018 | 2,834.5 | +0.8% (Computed by RemoteLaws) |
| 2019 | 2,814.0 | -0.7% (Computed by RemoteLaws) |
| 2020 | 2,654.7 | -5.7% (Computed by RemoteLaws) |
| 2021 | 2,607.9 | -1.8% (Computed by RemoteLaws) |
| 2022 | 2,804.2 | +7.5% (Computed by RemoteLaws) |
| 2023 | 2,569.0 | -8.4% (Computed by RemoteLaws) |
| 2024 | 2,488.4 | -3.1% (Computed by RemoteLaws) |
| 2025 | 2,414.2 | -3.0% (Computed by RemoteLaws) |
Source: BLS SOII, Table 1.
Injury Rates by Industry (2025)


Cite this chart (APA, MLA, HTML) and embed code
APA: RemoteLaws. (2026, November 21). Workplace injury and illness rate by industry, 2025 [Chart]. Data from U.S. Bureau of Labor Statistics, SOII (Nov. 18, 2026 release). https://remotelaws.com/statistics/workplace-injuries/
MLA: “Workplace injury and illness rate by industry, 2025.” RemoteLaws, 21 Nov. 2026, https://remotelaws.com/statistics/workplace-injuries/. Chart; data from U.S. Bureau of Labor Statistics, SOII (Nov. 18, 2026 release).
HTML link with attribution:
Embed this chart:
| Industry | Rate per 100 FTE workers | Cases (thousands) |
|---|---|---|
| Transportation & warehousing | 4.4 | 261.0 |
| Agriculture, forestry, fishing | 3.9 | 35.9 |
| Arts, entertainment, recreation | 3.7 | 57.5 |
| Health care & social assistance | 3.2 | 535.5 |
| Retail trade | 2.8 | 319.6 |
| Accommodation & food services | 2.7 | 235.4 |
| Manufacturing | 2.5 | 304.2 |
| Wholesale trade | 2.2 | 125.2 |
| Construction | 2.0 | 155.1 |
| Real estate & rental | 2.0 | 41.4 |
| Educational services | 1.8 | 42.0 |
| Other services | 1.8 | 63.5 |
| Utilities | 1.7 | 10.2 |
| Admin. & waste services | 1.7 | 95.5 |
| Mining & oil and gas | 1.1 | 7.1 |
| Information | 0.8 | 21.0 |
| Professional & technical services | 0.7 | 73.9 |
| Finance & insurance | 0.3 | 17.3 |
A high rate and a high number are not the same thing: health care and social assistance has the most cases because it employs so many people, while transportation and warehousing has the highest risk per worker.
Download the data (CSV) Every row carries its series, period, unit, source and release date.
Workers’ Compensation: Benefits Paid (2023, Separate Source)
The National Academy of Social Insurance (NASI) estimates that workers’ compensation paid $64.1 billion in benefits in 2023, covering nearly 150 million jobs and close to $11 trillion in wages. Medical care was more than 47% of benefits. Private insurers paid 55.6% of benefits, self-insured employers 25.6%, state funds 13.3% and the federal government 5.5% (NASI, August 11, 2026).
Methodology: What These Injury Numbers Measure
- Source: the Survey of Occupational Injuries and Illnesses (SOII) collects cases that employers record on their OSHA logs. Farms with fewer than 11 employees are excluded (BLS). Fatal injuries are counted separately, in the Census of Fatal Occupational Injuries.
- Number of cases vs rate: the rate is cases per 100 full-time-equivalent workers (200,000 hours worked). Use rates to compare industries of different sizes.
- Reported vs actual incidence: SOII counts cases employers recorded. Unreported injuries are not included, so the numbers are a floor, not a full measure of harm.
- Industry changes: 2025 industries use NAICS 2022, so compare with earlier years with caution.
- Publication date vs period: the November 18, 2026 release covers calendar year 2025. Detailed case and demographic data for 2025-2026 are due in 2027; BLS has not set a date for the next fatal-injury release.
How to Cite This Page and Reuse the Data
Free to use under CC BY 4.0. Journalists, researchers, bloggers and AI tools may quote any figure, ranking, index or chart on this page, including the indices computed by RemoteLaws, as long as they credit RemoteLaws with a link to this page. The underlying official data stay credited to their agencies.
Need a state breakdown, a custom chart or an expert comment? Contact the RemoteLaws Research Team.
APA: RemoteLaws Research Team. (2026, November 21). Workplace Injury Statistics 2026-2027 and the RemoteLaws Workplace Risk Index. RemoteLaws. https://remotelaws.com/statistics/workplace-injuries/
MLA: RemoteLaws Research Team. “Workplace Injury Statistics 2026-2027 and the RemoteLaws Workplace Risk Index.” RemoteLaws, 21 Nov. 2026, https://remotelaws.com/statistics/workplace-injuries/.
HTML link with attribution:
Frequently Asked Questions
What is the most dangerous state to work in?
On the RemoteLaws Workplace Risk Index, which combines nonfatal and fatal injury rates, Wyoming ranked first (269, U.S. = 100). On fatal injuries alone, Wyoming had the highest rate in 2024 (13.9 per 100,000 workers).
What is the safest state for workers?
The District of Columbia had the lowest Workplace Risk Index (72) among the 43 jurisdictions with both rates. Rhode Island had the lowest fatal injury rate in 2024 (1.1 per 100,000) but has no published state nonfatal rate.
How often does a workplace injury happen?
About every 13 seconds in private industry in 2025, based on 2,414,200 recorded cases (Computed by RemoteLaws from BLS SOII).
How many workplace injuries were there in 2025?
Private employers reported 2,414,200 nonfatal injuries and illnesses in 2025, down 3.0% from 2024 (BLS SOII, released November 18, 2026).
What is the workplace injury rate in the US?
2.3 recordable cases per 100 full-time-equivalent workers in private industry in 2025, the same as in 2024.
Which industry has the most workplace injuries?
Health care and social assistance had the most cases (535,500) in 2025. Transportation and warehousing had the highest rate (4.4 per 100 workers).
Are workplace injuries going down?
Reported cases fell from 2,857,400 in 2016 to 2,414,200 in 2025, a 15.5% decrease (Computed by RemoteLaws from BLS SOII). The rate was unchanged between 2024 and 2025.
How much does workers compensation pay each year?
NASI estimates $64.1 billion in benefits in 2023, more than 47% of it for medical care. That is a different year and population than the BLS injury counts.
Do these statistics include fatal injuries?
No. SOII covers nonfatal cases. Fatal work injuries are counted in the BLS Census of Fatal Occupational Injuries.
Sources, Methodology Notes & Update Log
- Cases, rates and industries: BLS SOII release of November 18, 2026, Tables 1 and 2, read November 21, 2026. Detailed tables: BLS IIF tables.
- State rates: BLS SOII state rates, private industry, 2025, BLS SOII state DART rates, 2025 and BLS CFOI fatal injury rates by state, 2007-2024, read November 21, 2026.
- Workers’ compensation: NASI, Workers’ Compensation: Benefits, Costs, and Coverage, 2023 Data (August 11, 2026).
- Computed by RemoteLaws: the Workplace Risk Index, industry risk multiples, cases per second and deaths per minute, state changes since 2019 and year-over-year changes. No figure on this page is estimated.
- Update log: November 21, 2026, page created; same day, state rankings and RemoteLaws indices added.