
US Remote Work Statistics — Original RemoteLaws analysis of official data — Updated November 21, 2026
Remote Work Statistics 2026-2027: 22.1% of US Workers Telework, Every State Ranked
35.2 million people, 22.1% of everyone at work, teleworked in October 2026; 48% of them were fully remote. By state, the 2025 rate ran from 8.4% in Mississippi to 49.5% in DC, and it fell in 26 of 51 states. This page ranks every state, measures the gaps by gender, age, race, education and job, and adds RemoteLaws indices you can cite, with charts and CSV files.

By the RemoteLaws Research Team · Published November 21, 2026 · Latest data: October 2026 (national, CPS A-41/A-42); 2025 annual averages (states) · Next update: with the November 2026 Employment Situation (BLS schedule)
Key Remote Work Statistics 2026-2027 (Latest Data and RemoteLaws Indices)
- Remote work has plateaued: the telework rate went from 17.9% in October 2022 to a peak of 23.8% in October 2024 and 22.1% in October 2026. Nearly all the growth since 2022 came from hybrid work (some hours +3.4 points vs all hours +0.9). BLS CPS monthly series; changes Computed by RemoteLaws (source)
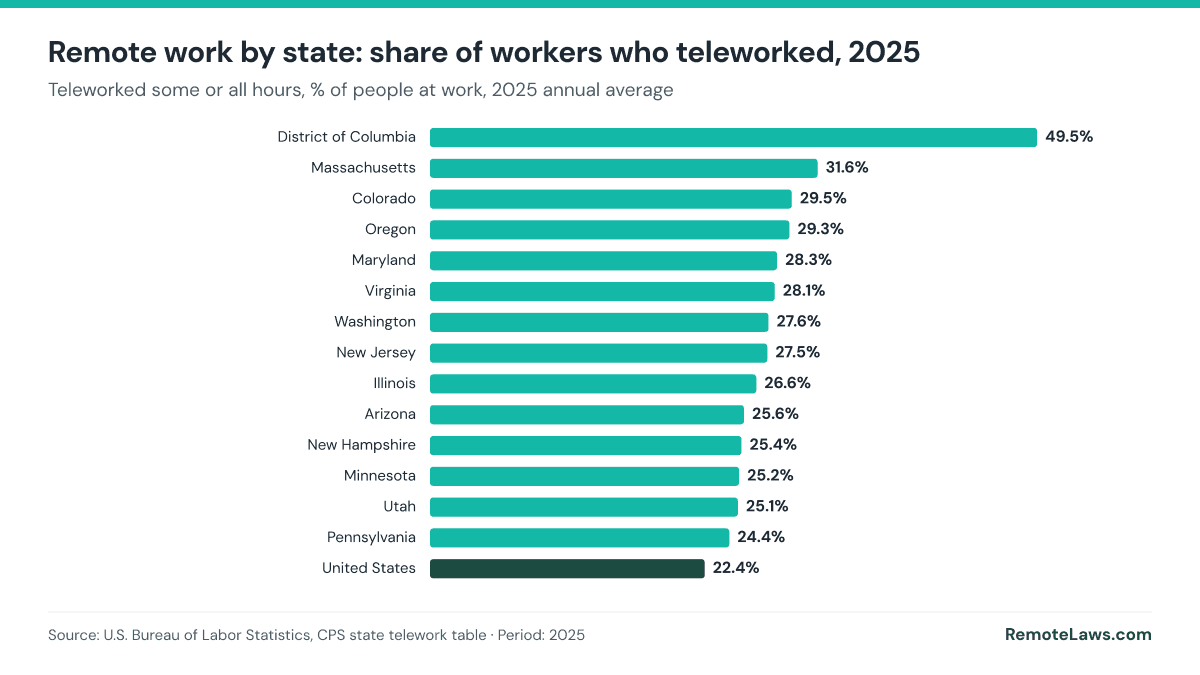
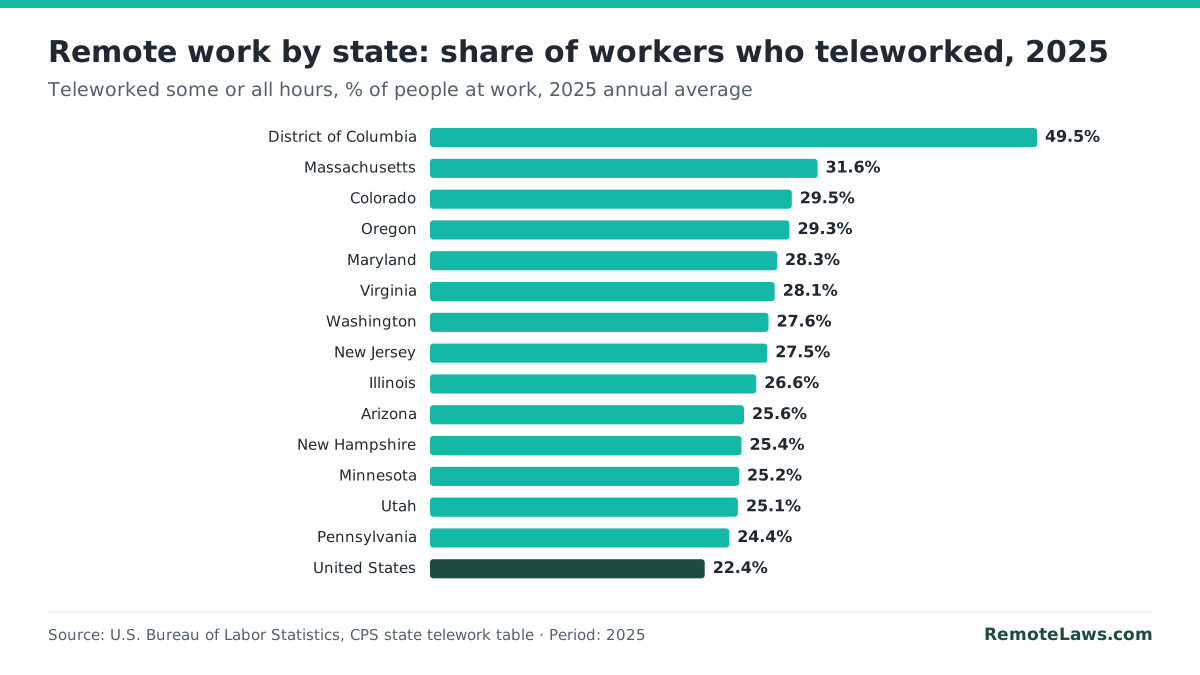
- The District of Columbia had the highest telework rate in 2025 (49.5%), followed by Massachusetts (31.6%) and Colorado (29.5%); Mississippi had the lowest (8.4%). BLS state telework table, 2025 annual averages (source)
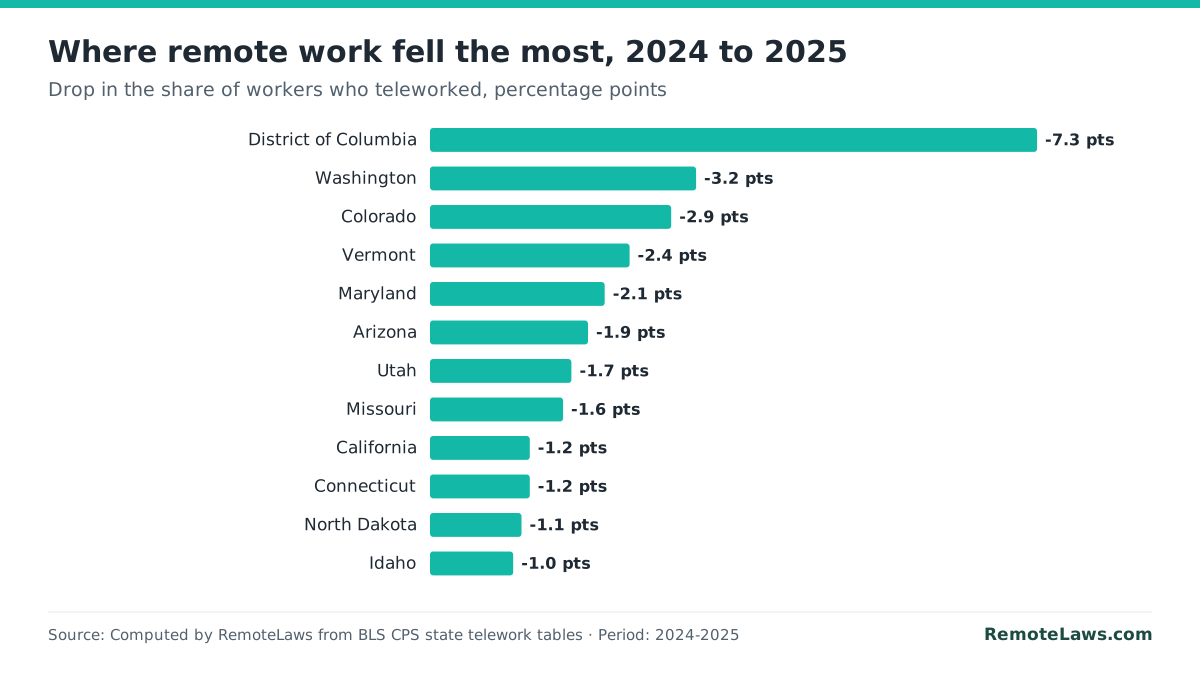
- Remote work fell in 26 of 51 states (including DC) between 2024 and 2025. The steepest drop was in DC, -7.3 points (from 56.8% to 49.5%), the year federal agencies ordered employees back to the office. Computed by RemoteLaws from BLS state telework tables 2024-2025 (source)
- RemoteLaws Fully Remote Share: of the 35.2 million people who teleworked in October 2026, 48% did so for all their hours; the rest were hybrid. Computed by RemoteLaws from BLS CPS table A-42 (source)
- Women teleworked more than men in October 2026 (24.3% vs 20.0%) and were far more likely to be fully remote (12.6% vs 8.8%). BLS CPS table A-41, October 2026 (source)
- Workers with a bachelor’s degree or higher were 4.5 times as likely to telework as high school graduates without college (38.2% vs 8.5%). Computed by RemoteLaws from BLS CPS table A-41, October 2026 (source)
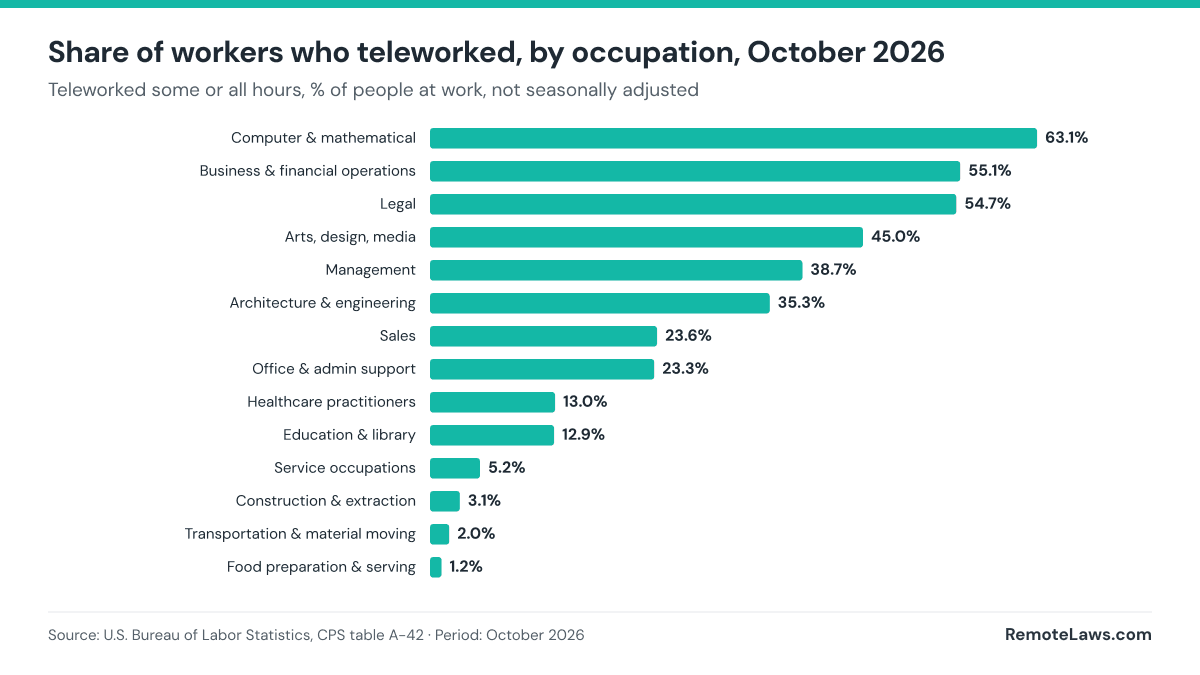
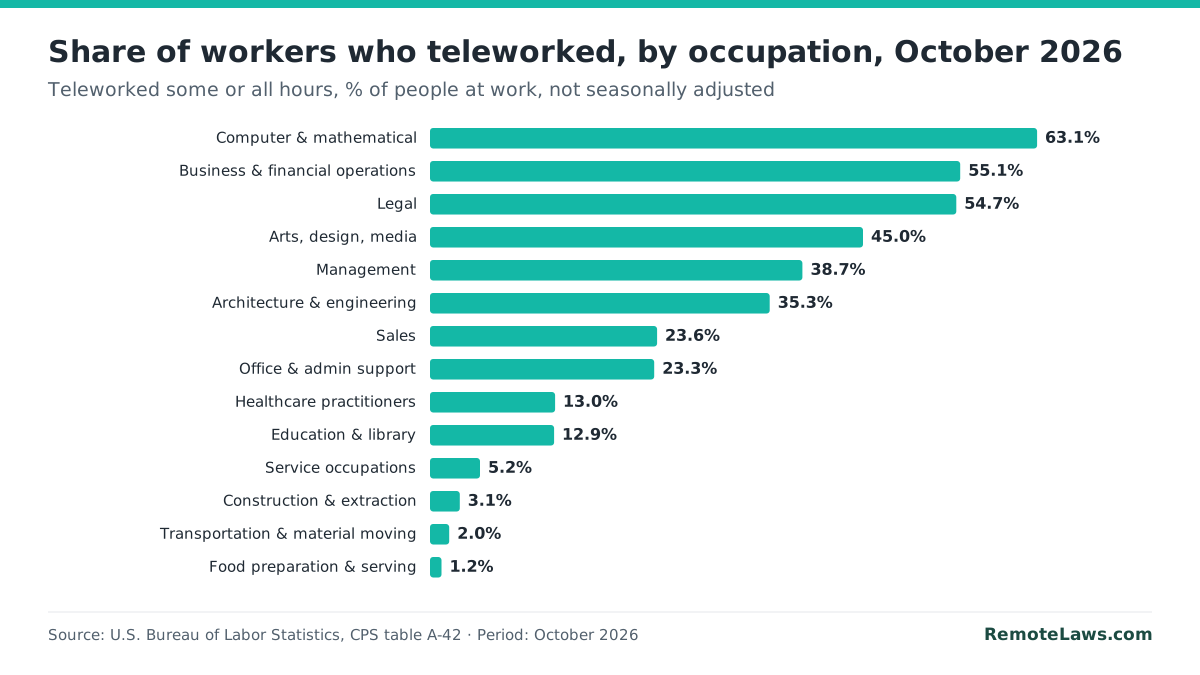
- Computer and mathematical workers were 53 times as likely to telework as food preparation and serving workers (63.1% vs 1.2%), the widest occupational gap in the data. Computed by RemoteLaws from BLS CPS table A-42 (source)
- 35.2 million people (35,165,000), or 22.1% of everyone at work, teleworked or worked at home for pay in the October 2026 reference week. BLS CPS table A-42, October 2026, not seasonally adjusted (source)
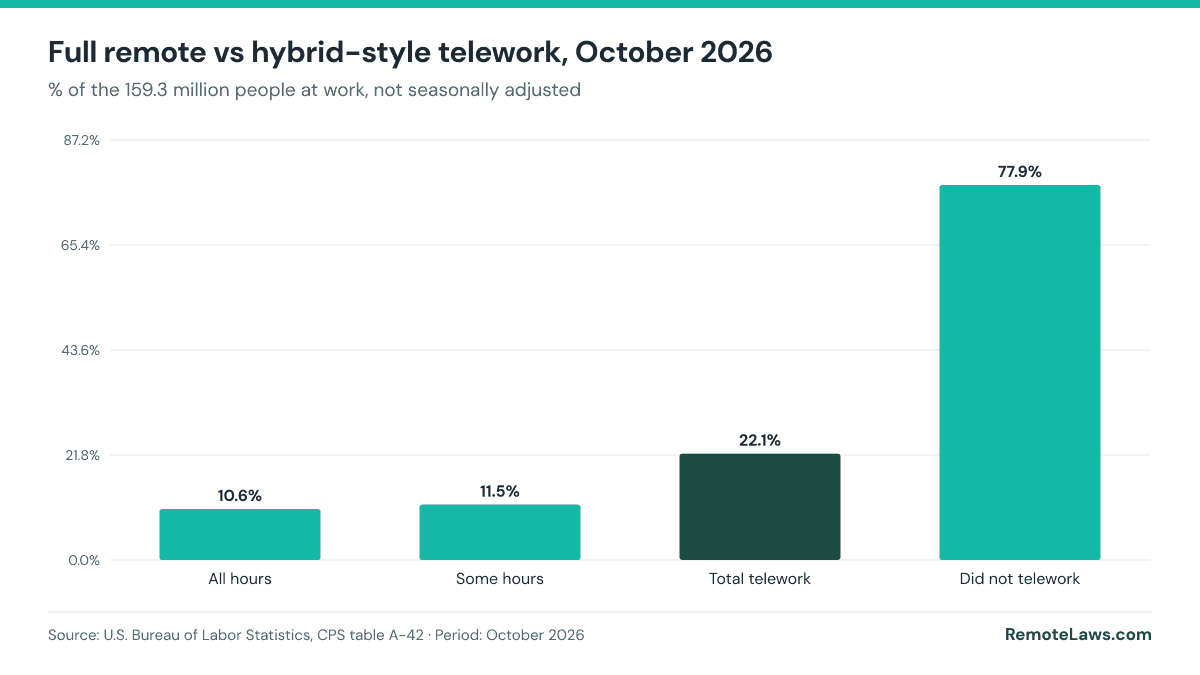
- 10.6% of people at work teleworked for all their hours and 11.5% for some of their hours. BLS CPS table A-42, October 2026 (source)
- Full-time workers teleworked more often than part-time workers: 23.5% vs 15.3%. BLS CPS table A-42, October 2026 (source)
- Computer and mathematical occupations had the highest telework rate, 63.1%; food preparation and serving had the lowest, 1.2%. BLS CPS table A-42, October 2026 (source)
- By industry, finance and insurance led at 59.5%, ahead of professional and technical services (58.1%); accommodation and food services was at 4.6%. BLS CPS table A-42, October 2026 (source)
- Self-employed workers teleworked more than employees: 36.9% vs 20.5% of wage and salary workers. BLS CPS table A-42, October 2026 (source)
- In government, 25.1% of state workers, 17.6% of federal workers and 9.4% of local government workers teleworked. BLS CPS table A-42, October 2026 (source)
Each line can be quoted as written. Please link to this page and keep the source and period. Lines marked Computed by RemoteLaws are original RemoteLaws calculations from official data.
Remote Work by State: All 50 States Ranked (2025)
The national rate hides a wide spread: in 2025 the share of workers who teleworked ranged from 8.4% in Mississippi to 49.5% in the District of Columbia. The table also shows how each state changed since 2024 and the RemoteLaws Fully Remote Share, the percentage of a state’s teleworkers who worked from home for all their hours rather than hybrid.
Cite this chart (APA, MLA, HTML) and embed code
APA: RemoteLaws. (2026, November 21). Remote work by state: share of workers who teleworked, 2025 [Chart]. Data from U.S. Bureau of Labor Statistics, state telework table, 2025 annual averages. https://remotelaws.com/statistics/remote-work/
MLA: “Remote work by state: share of workers who teleworked, 2025.” RemoteLaws, 21 Nov. 2026, https://remotelaws.com/statistics/remote-work/. Chart; data from U.S. Bureau of Labor Statistics, state telework table, 2025 annual averages.
HTML link with attribution:
Embed this chart:
| Rank | State | Teleworked (total) | Some hours | All hours | Change vs 2024 | Fully Remote Share |
|---|---|---|---|---|---|---|
| 1 | District of Columbia | 49.5% | 31.2% | 18.3% | -7.3 pts | 37% |
| 2 | Massachusetts | 31.6% | 19.7% | 11.9% | +0.2 pts | 38% |
| 3 | Colorado | 29.5% | 14.5% | 15.0% | -2.9 pts | 51% |
| 4 | Oregon | 29.3% | 14.5% | 14.9% | +0.0 pts | 51% |
| 5 | Maryland | 28.3% | 16.0% | 12.3% | -2.1 pts | 43% |
| 6 | Virginia | 28.1% | 14.2% | 13.9% | -0.5 pts | 49% |
| 7 | Washington | 27.6% | 14.1% | 13.5% | -3.2 pts | 49% |
| 8 | New Jersey | 27.5% | 16.5% | 11.1% | +0.4 pts | 40% |
| 9 | Illinois | 26.6% | 15.5% | 11.1% | +0.3 pts | 42% |
| 10 | Arizona | 25.6% | 12.5% | 13.1% | -1.9 pts | 51% |
| 11 | New Hampshire | 25.4% | 13.2% | 12.2% | -0.6 pts | 48% |
| 12 | Minnesota | 25.2% | 14.6% | 10.6% | -0.7 pts | 42% |
| 13 | Utah | 25.1% | 13.2% | 11.9% | -1.7 pts | 47% |
| 14 | Pennsylvania | 24.4% | 12.4% | 12.0% | +0.6 pts | 49% |
| 15 | California | 24.3% | 13.8% | 10.5% | -1.2 pts | 43% |
| 16 | Maine | 24.3% | 12.6% | 11.8% | +0.8 pts | 49% |
| 17 | Connecticut | 24.0% | 13.7% | 10.4% | -1.2 pts | 43% |
| 18 | Vermont | 23.9% | 13.7% | 10.2% | -2.4 pts | 43% |
| 19 | Delaware | 23.6% | 12.8% | 10.9% | +1.2 pts | 46% |
| 20 | Rhode Island | 23.5% | 14.0% | 9.5% | +0.1 pts | 40% |
| 21 | Wisconsin | 23.4% | 13.0% | 10.4% | +1.5 pts | 44% |
| 22 | North Carolina | 22.8% | 11.3% | 11.5% | +0.8 pts | 50% |
| 23 | Texas | 22.0% | 11.0% | 11.0% | -0.5 pts | 50% |
| 24 | Michigan | 21.8% | 12.7% | 9.0% | +0.6 pts | 41% |
| 25 | Georgia | 21.5% | 10.9% | 10.6% | -0.8 pts | 49% |
| 26 | New York | 21.5% | 12.8% | 8.7% | +0.3 pts | 40% |
| 27 | Ohio | 21.2% | 11.3% | 10.0% | -0.1 pts | 47% |
| 28 | South Carolina | 20.5% | 9.3% | 11.2% | +2.3 pts | 55% |
| 29 | Montana | 20.3% | 9.5% | 10.7% | -0.3 pts | 53% |
| 30 | Missouri | 20.2% | 11.5% | 8.7% | -1.6 pts | 43% |
| 31 | Tennessee | 19.7% | 9.0% | 10.7% | +0.2 pts | 54% |
| 32 | Kansas | 19.3% | 11.4% | 7.9% | -1.0 pts | 41% |
| 33 | Idaho | 18.7% | 8.5% | 10.2% | -1.0 pts | 55% |
| 34 | Florida | 18.5% | 7.4% | 11.1% | -0.5 pts | 60% |
| 35 | Indiana | 18.0% | 10.2% | 7.8% | -0.2 pts | 43% |
| 36 | Nebraska | 18.0% | 10.1% | 8.0% | -0.2 pts | 44% |
| 37 | Alaska | 17.4% | 10.2% | 7.2% | +0.6 pts | 41% |
| 38 | Nevada | 17.4% | 7.2% | 10.3% | +1.3 pts | 59% |
| 39 | New Mexico | 17.0% | 8.6% | 8.5% | -0.4 pts | 50% |
| 40 | Iowa | 16.4% | 9.0% | 7.3% | +0.7 pts | 45% |
| 41 | Kentucky | 16.2% | 8.0% | 8.2% | +0.6 pts | 51% |
| 42 | Hawaii | 15.8% | 9.5% | 6.3% | +0.0 pts | 40% |
| 43 | South Dakota | 14.9% | 7.7% | 7.2% | +0.3 pts | 48% |
| 44 | Oklahoma | 14.5% | 7.9% | 6.6% | -0.2 pts | 46% |
| 45 | Wyoming | 14.0% | 6.7% | 7.3% | +0.5 pts | 52% |
| 46 | North Dakota | 13.2% | 7.1% | 6.1% | -1.1 pts | 46% |
| 47 | Louisiana | 13.0% | 6.1% | 6.9% | +0.2 pts | 53% |
| 48 | West Virginia | 12.4% | 5.7% | 6.7% | +0.1 pts | 54% |
| 49 | Arkansas | 12.1% | 6.1% | 5.9% | +0.5 pts | 49% |
| 50 | Alabama | 10.4% | 4.6% | 5.7% | -0.3 pts | 55% |
| 51 | Mississippi | 8.4% | 3.5% | 4.8% | +1.1 pts | 57% |
Source: BLS, States: persons at work by telework status, 2025 annual averages and 2024 annual averages. Change and Fully Remote Share computed by RemoteLaws. 2025 figures are 11-month averages because October 2025 data were not collected during the federal shutdown, so BLS says they are not strictly comparable with other years. State links go to each state’s employment law guide.
Where remote work fell the most

Cite this chart (APA, MLA, HTML) and embed code
APA: RemoteLaws. (2026, November 21). Where remote work fell the most, 2024 to 2025 [Chart]. Data from Computed by RemoteLaws from BLS state telework tables 2024 and 2025. https://remotelaws.com/statistics/remote-work/
MLA: “Where remote work fell the most, 2024 to 2025.” RemoteLaws, 21 Nov. 2026, https://remotelaws.com/statistics/remote-work/. Chart; data from Computed by RemoteLaws from BLS state telework tables 2024 and 2025.
HTML link with attribution:
Embed this chart:
Most of the largest declines are in states with big public-sector or tech workforces. In the other direction, South Carolina gained the most (+2.3 points). Fully remote work is most common among teleworkers in Florida (60% of teleworkers) and least common in the District of Columbia (37%), where hybrid dominates (Computed by RemoteLaws).
Remote Work Trend: October 2022 to October 2026
Remote work is not shrinking or booming: it has plateaued. The telework rate rose from 17.9% in October 2022 to a peak of 23.8% in October 2024, then eased to 22.1% in October 2026. From January to September 2026 it averaged 22.1%, against 22.4% in the same months of 2025 (Computed by RemoteLaws).
The growth came from hybrid, not fully remote work. Since October 2022, the share working from home for some hours rose from 8.1% to 11.5% (+3.4 points), while the share working from home for all hours barely moved, from 9.7% to 10.6% (+0.9). Hybrid overtook fully remote telework in November 2023 and has stayed ahead every month since. The RemoteLaws Fully Remote Share fell from 54% of teleworkers in October 2022 to 48% in October 2026 (Computed by RemoteLaws).


Cite this chart (APA, MLA, HTML) and embed code
APA: RemoteLaws. (2026, November 21). Remote work in the US, October 2022 to October 2026 [Chart]. Data from U.S. Bureau of Labor Statistics, CPS series LNU0201B46B, LNU0201B4DD, LNU0201B54F. https://remotelaws.com/statistics/remote-work/
MLA: “Remote work in the US, October 2022 to October 2026.” RemoteLaws, 21 Nov. 2026, https://remotelaws.com/statistics/remote-work/. Chart; data from U.S. Bureau of Labor Statistics, CPS series LNU0201B46B, LNU0201B4DD, LNU0201B54F.
HTML link with attribution:
Embed this chart:
| October | Teleworked (total) | Some hours | All hours | Fully Remote Share (Computed by RemoteLaws) |
|---|---|---|---|---|
| 2022 | 17.9% | 8.1% | 9.7% | 54% |
| 2023 | 19.8% | 9.6% | 10.1% | 51% |
| 2024 | 23.8% | 12.7% | 11.1% | 47% |
| 2026 | 22.1% | 11.5% | 10.6% | 48% |
Source: BLS CPS series LNU0201B46B (total), LNU0201B4DD (some hours) and LNU0201B54F (all hours), retrieved November 21, 2026. October 2025 was not collected because of the federal government shutdown; January 2026 reflects updated population controls. Compare the same month across years because the data are not seasonally adjusted.
Download the monthly series (CSV)
Who Works Remotely: Gender, Age, Race and Education Gaps
Remote work is not spread evenly. Education is the strongest divide: the more schooling, the more telework. Women are more likely than men to work from home for all their hours, and workers 65 and over have the highest fully remote rate of any age group.
| Group | Teleworked (total) | Some hours | All hours | Fully Remote Share (Computed by RemoteLaws) |
|---|---|---|---|---|
| Men | 20.0% | 11.3% | 8.8% | 44% |
| Women | 24.3% | 11.7% | 12.6% | 52% |
| Age 16-24 | 5.9% | 3.5% | 2.4% | 41% |
| Age 25-34 | 20.8% | 11.8% | 9.1% | 44% |
| Age 35-44 | 27.4% | 14.0% | 13.4% | 49% |
| Age 45-54 | 26.1% | 13.6% | 12.4% | 48% |
| Age 55-64 | 23.0% | 11.6% | 11.4% | 50% |
| Age 65 and over | 23.9% | 10.1% | 13.8% | 58% |
| White | 22.7% | 11.9% | 10.8% | 48% |
| Black or African American | 15.0% | 7.3% | 7.7% | 51% |
| Asian | 30.3% | 16.2% | 14.1% | 47% |
| Hispanic or Latino | 12.4% | 6.4% | 6.0% | 48% |
| Less than high school (25+) | 3.4% | 1.3% | 2.1% | 62% |
| High school, no college (25+) | 8.5% | 3.9% | 4.6% | 54% |
| Some college or associate (25+) | 18.0% | 8.0% | 10.0% | 56% |
| Bachelor’s only (25+) | 36.4% | 18.9% | 17.5% | 48% |
| Advanced degree (25+) | 41.0% | 23.6% | 17.4% | 42% |
Source: BLS CPS table A-41, October 2026. Fully Remote Share = all-hours telework ÷ total telework, computed by RemoteLaws.
Remote Work by Occupation
Cite this chart (APA, MLA, HTML) and embed code
APA: RemoteLaws. (2026, November 21). Share of workers who teleworked, by occupation, October 2026 [Chart]. Data from U.S. Bureau of Labor Statistics, CPS table A-42. https://remotelaws.com/statistics/remote-work/
MLA: “Share of workers who teleworked, by occupation, October 2026.” RemoteLaws, 21 Nov. 2026, https://remotelaws.com/statistics/remote-work/. Chart; data from U.S. Bureau of Labor Statistics, CPS table A-42.
HTML link with attribution:
Embed this chart:
Fully Remote vs Some Hours at Home
Cite this chart (APA, MLA, HTML) and embed code
APA: RemoteLaws. (2026, November 21). Full remote vs hybrid-style telework, October 2026 [Chart]. Data from U.S. Bureau of Labor Statistics, CPS table A-42. https://remotelaws.com/statistics/remote-work/
MLA: “Full remote vs hybrid-style telework, October 2026.” RemoteLaws, 21 Nov. 2026, https://remotelaws.com/statistics/remote-work/. Chart; data from U.S. Bureau of Labor Statistics, CPS table A-42.
HTML link with attribution:
Embed this chart:
| Group | People at work | Teleworked | Total % | Some hours % | All hours % |
|---|---|---|---|---|---|
| All people at work | 159,255 | 35,165 | 22.1% | 11.5% | 10.6% |
| Full-time workers | 132,175 | 31,022 | 23.5% | 12.9% | 10.6% |
| Part-time workers | 27,079 | 4,144 | 15.3% | 4.8% | 10.5% |
| Wage and salary workers | 143,549 | 29,400 | 20.5% | 11.1% | 9.4% |
| Private industries | 122,239 | 25,852 | 21.1% | 11.0% | 10.1% |
| Federal government | 3,993 | 705 | 17.6% | 10.6% | 7.0% |
| State government | 7,702 | 1,935 | 25.1% | 16.6% | 8.5% |
| Local government | 9,615 | 907 | 9.4% | 7.7% | 1.7% |
| Self-employed | 15,613 | 5,760 | 36.9% | 15.4% | 21.5% |
Source: BLS CPS table A-42.
Remote Work by Industry
| Industry | Teleworked (some or all hours) |
|---|---|
| Finance & insurance | 59.5% |
| Professional & technical services | 58.1% |
| Information | 50.8% |
| Real estate | 39.3% |
| Utilities | 26.1% |
| Wholesale trade | 24.1% |
| Public administration | 22.7% |
| Manufacturing | 19.5% |
| Health care & social assistance | 18.5% |
| Educational services | 16.5% |
| Construction | 10.6% |
| Retail trade | 10.4% |
| Transportation & warehousing | 6.5% |
| Accommodation & food | 4.6% |
Download the data (CSV) Every row carries its period, seasonal adjustment and source.
Methodology: What “Telework” Means in Official Data
- Definition: the Current Population Survey counts people who teleworked or worked at home for pay at any time during the survey reference week. The telework rate is that number as a share of people who were employed and at work that week (BLS).
- A weekly snapshot, not a contract: the data describe one reference week. They do not say whether a job is officially remote, hybrid or on-site, and a person who worked from home one day that week counts as “some hours”.
- Who is excluded: people absent from work the whole week (vacation, illness, holidays) are not in the base.
- Not seasonally adjusted: compare October with October; month-to-month moves can be seasonal.
- History: BLS added the telework questions in October 2022. Starting with January 2025 data, industries follow the 2022 Census classification, so 2025 and later figures are not strictly comparable with earlier years (A-42 notes).
- Publication date vs period: October 2026 data were published with the Employment Situation for October 2026. Table A-42 is replaced each month with the newest month.
How to Cite This Page and Reuse the Data
Free to use under CC BY 4.0. Journalists, researchers, bloggers and AI tools may quote any figure, ranking, index or chart on this page, including the indices computed by RemoteLaws, as long as they credit RemoteLaws with a link to this page. The underlying official data stay credited to their agencies.
Need a state breakdown, a custom chart or an expert comment? Contact the RemoteLaws Research Team.
APA: RemoteLaws Research Team. (2026, November 21). Remote Work Statistics 2026-2027: Every State Ranked. RemoteLaws. https://remotelaws.com/statistics/remote-work/
MLA: RemoteLaws Research Team. “Remote Work Statistics 2026-2027: Every State Ranked.” RemoteLaws, 21 Nov. 2026, https://remotelaws.com/statistics/remote-work/.
HTML link with attribution:
Frequently Asked Questions
Which state has the most remote workers?
By share of workers, the District of Columbia (49.5% in 2025), then Massachusetts (31.6%) and Colorado (29.5%). By number, California, with about 4.4 million teleworkers (Computed by RemoteLaws from BLS 2025 annual averages).
Is remote work declining?
Slightly. The national telework rate was 22.4% in 2025 against 22.8% in 2024, and it fell in 26 of 51 states, most in DC (-7.3 points). Month by month, it peaked at 23.8% in October 2024 and was 22.1% in October 2026, still above the 17.9% of October 2022. 2025 figures exclude October 2025, so compare them with care.
What is the RemoteLaws Fully Remote Share?
The percentage of teleworkers who worked from home for all their hours in the reference week, rather than part of the week. It is computed by RemoteLaws from BLS data and was 48% nationally in October 2026.
What percentage of Americans work remotely?
22.1% of people at work teleworked or worked at home for pay in the October 2026 reference week: 10.6% for all their hours and 11.5% for some hours (BLS CPS table A-42).
How many people work from home in the US?
35,165,000 people teleworked at least part of the October 2026 reference week, out of 159,255,000 people at work. 16,874,000 did so for all their hours.
What jobs have the most remote workers?
Computer and mathematical occupations (63.1%), business and financial operations (55.1%) and legal occupations (54.7%) had the highest telework rates in October 2026.
Does “telework” mean fully remote?
No. BLS counts anyone who teleworked or worked at home for pay at any time in the reference week. Only the “all hours” group (10.6% in October 2026) worked entirely from home that week.
Which industries telework the most?
Finance and insurance (59.5%), professional and technical services (58.1%) and information (50.8%) in October 2026.
Sources, Methodology Notes & Update Log
- National figures: BLS CPS table A-42 and table A-41, October 2026, read November 21, 2026. Definitions and history: BLS telework page.
- State figures: BLS, States: persons at work by telework status, 2025 annual averages and 2024 annual averages, read November 21, 2026.
- Computed by RemoteLaws: state changes 2024-2025, the Fully Remote Share, the education and occupation gap ratios and state teleworker counts.
- Monthly trend: BLS CPS series LNU0201B46B, LNU0201B4DD and LNU0201B54F, October 2022 to October 2026, retrieved November 21, 2026.
- Update log: November 21, 2026, page created; same day, state rankings, demographic gaps, RemoteLaws indices and the monthly trend since October 2022 added.