
US Layoff Statistics — Original RemoteLaws analysis of official data — Updated November 21, 2026
US Layoff Statistics 2026-2027: 21.2 Million Layoffs in 2025 and Every State Ranked
US employers made 21.2 million layoffs and discharges in 2025, about 40 every minute, and 33.7 for every 100 hires. In September 2026 the monthly count was 1.6 million (1.0%). Beyond the official BLS series, this page ranks all 50 states and DC with the RemoteLaws Layoff Pressure Index, shows where layoffs rose fastest, and gives every number with its source, period and a free CSV.

By the RemoteLaws Research Team · Published November 21, 2026 · Latest data: September 2026 (national JOLTS); 2025 annual (state JOLTS) · Next update: December 1, 2026 (October 2026 data)
Key Layoff Statistics 2026-2027 (Latest Data and RemoteLaws Indices)
- RemoteLaws Layoff Pressure Index: US employers made 33.7 layoffs and discharges for every 100 hires in 2025 (21,239,000 layoffs against 62,972,000 hires). Computed by RemoteLaws from BLS State JOLTS annual estimates, released July 22, 2026 (Tables 13, 17 and 19)
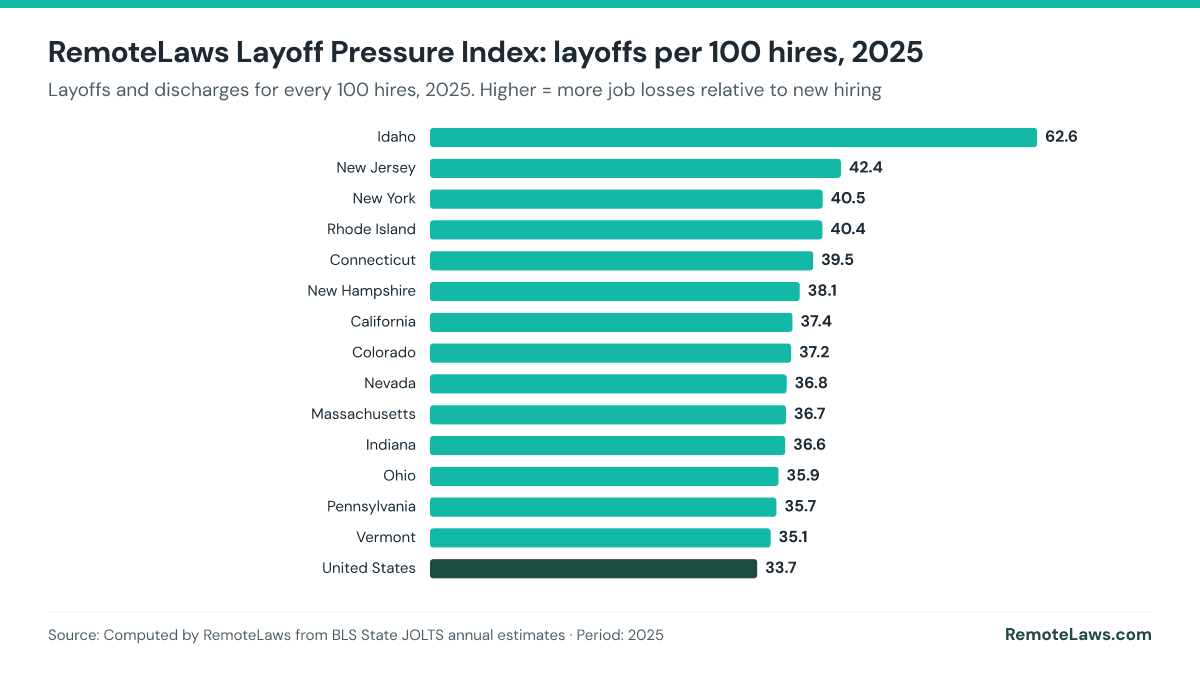
- Idaho had the highest Layoff Pressure Index in 2025 (62.6 layoffs per 100 hires); West Virginia had the lowest (26.2). Computed by RemoteLaws from BLS State JOLTS, 2025 (source)
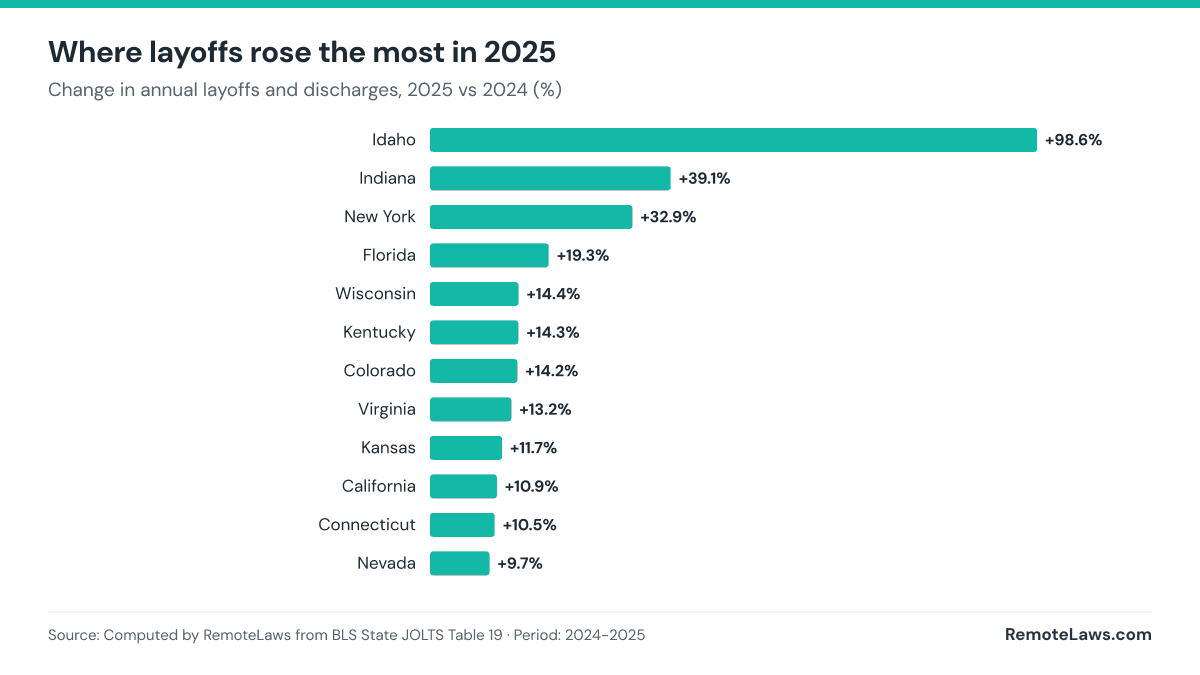
- Layoffs rose in 30 of 51 states (including DC) in 2025. The largest increases were in Idaho (+98.6%), Indiana (+39.1%) and New York (+32.9%). Computed by RemoteLaws from BLS State JOLTS Table 19 (source)
- That works out to about 40 layoffs or discharges every minute in 2025, around the clock. Computed by RemoteLaws: 21,239,000 ÷ 525,600 minutes, from BLS JOLTS Table 23
- US employers made about 1.6 million layoffs and discharges in September 2026 (1,641,000), a rate of 1.0% of employment. BLS JOLTS, seasonally adjusted, preliminary; released November 3, 2026 (source)
- That is 175,000 fewer than in September 2025 (1,816,000, rate 1.1%). Computed by RemoteLaws from BLS JOLTS Table 5 (source)
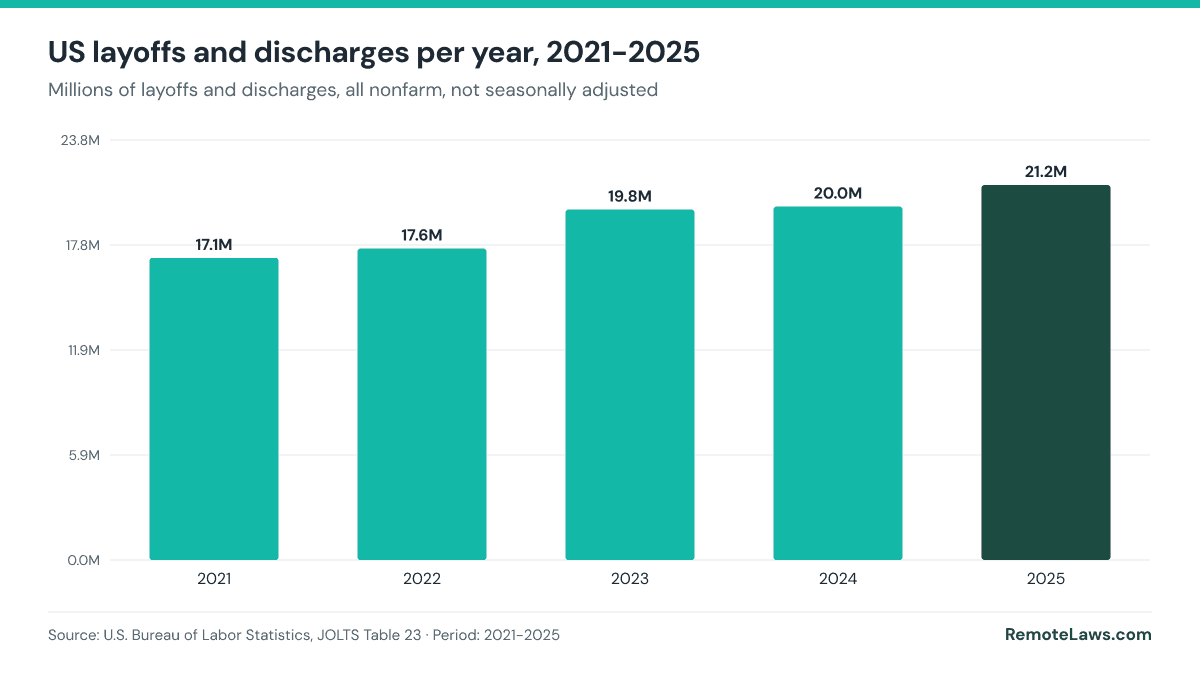
- Layoffs and discharges totaled 21.2 million in 2025 (21,239,000), up 1.2 million from 2024 and the highest of the five years BLS shows in its annual table. BLS JOLTS Table 23, not seasonally adjusted, calendar 2021-2025 (source)
- Layoffs and discharges were 33.8% of all job separations in 2025; quits were 60.6%. BLS JOLTS annual estimates, released March 13, 2026 (source)
- In September 2026, workers quit about 2 times as often as they were laid off: 3,365,000 quits against 1,641,000 layoffs and discharges. Ratio computed by RemoteLaws from BLS JOLTS Tables 4 and 5 (source)
- The highest layoff rate in September 2026 was in arts, entertainment and recreation (3.5%); the largest number was in professional and business services (419,000, rate 1.9%). BLS JOLTS Table 5, preliminary (source)
- The federal government had the lowest rate of any industry shown, 0.2% (5,000 layoffs and discharges). BLS JOLTS Table 5, preliminary (source)
Each line can be quoted as written. Please link to this page and keep the source and period. Lines marked Computed by RemoteLaws are original RemoteLaws calculations from official data.
Layoffs by State: The RemoteLaws Layoff Pressure Index (2025)
A raw layoff count mostly tells you how big a state is. To compare states fairly, RemoteLaws divides each state’s layoffs and discharges by its hires in the same year. The result, the Layoff Pressure Index, answers a simple question: for every 100 people hired, how many were laid off or fired? Above the U.S. figure of 33.7 means job losses weighed more heavily against new hiring than in the country as a whole.

Cite this chart (APA, MLA, HTML) and embed code
APA: RemoteLaws. (2026, November 21). RemoteLaws Layoff Pressure Index: layoffs per 100 hires, 2025 [Chart]. Data from Computed by RemoteLaws from BLS State JOLTS (annual 2025). https://remotelaws.com/statistics/layoffs/
MLA: “RemoteLaws Layoff Pressure Index: layoffs per 100 hires, 2025.” RemoteLaws, 21 Nov. 2026, https://remotelaws.com/statistics/layoffs/. Chart; data from Computed by RemoteLaws from BLS State JOLTS (annual 2025).
HTML link with attribution:
Embed this chart:
| Rank | State | Layoffs and discharges 2025 | Hires 2025 | Layoffs per 100 hires | Change in layoffs vs 2024 | Quits per layoff |
|---|---|---|---|---|---|---|
| 1 | Idaho | 276,000 | 441,000 | 62.6 | +98.6% | 0.94 |
| 2 | New Jersey | 723,000 | 1,707,000 | 42.4 | +3.7% | 1.09 |
| 3 | New York | 1,508,000 | 3,726,000 | 40.5 | +32.9% | 1.32 |
| 4 | Rhode Island | 93,000 | 230,000 | 40.4 | +4.5% | 1.24 |
| 5 | Connecticut | 252,000 | 638,000 | 39.5 | +10.5% | 1.37 |
| 6 | New Hampshire | 109,000 | 286,000 | 38.1 | -6.0% | 1.39 |
| 7 | California | 2,439,000 | 6,527,000 | 37.4 | +10.9% | 1.60 |
| 8 | Colorado | 507,000 | 1,362,000 | 37.2 | +14.2% | 1.46 |
| 9 | Nevada | 261,000 | 710,000 | 36.8 | +9.7% | 1.46 |
| 10 | Massachusetts | 447,000 | 1,218,000 | 36.7 | +4.2% | 1.43 |
| 11 | Indiana | 580,000 | 1,584,000 | 36.6 | +39.1% | 1.79 |
| 12 | Ohio | 819,000 | 2,280,000 | 35.9 | +4.3% | 1.89 |
| 13 | Pennsylvania | 713,000 | 1,996,000 | 35.7 | -15.9% | 1.68 |
| 14 | Vermont | 46,000 | 131,000 | 35.1 | -2.1% | 1.57 |
| 15 | Illinois | 897,000 | 2,578,000 | 34.8 | +8.5% | 1.66 |
| 16 | District of Columbia | 74,000 | 217,000 | 34.1 | +7.2% | 2.16 |
| 17 | Maine | 96,000 | 283,000 | 33.9 | +7.9% | 1.45 |
| 18 | North Dakota | 68,000 | 202,000 | 33.7 | -4.2% | 1.87 |
| 19 | Tennessee | 501,000 | 1,496,000 | 33.5 | +8.0% | 1.93 |
| 20 | Kansas | 191,000 | 574,000 | 33.3 | +11.7% | 1.95 |
| 21 | Nebraska | 133,000 | 401,000 | 33.2 | +0.8% | 1.98 |
| 22 | South Dakota | 67,000 | 203,000 | 33.0 | +6.3% | 2.00 |
| 23 | Washington | 401,000 | 1,223,000 | 32.8 | -7.2% | 1.75 |
| 24 | Wisconsin | 374,000 | 1,148,000 | 32.6 | +14.4% | 1.89 |
| 25 | Kentucky | 279,000 | 861,000 | 32.4 | +14.3% | 1.77 |
| 26 | Virginia | 557,000 | 1,720,000 | 32.4 | +13.2% | 1.88 |
| 27 | Michigan | 667,000 | 2,063,000 | 32.3 | -3.2% | 1.84 |
| 28 | Utah | 245,000 | 762,000 | 32.2 | +0.8% | 1.91 |
| 29 | Florida | 1,373,000 | 4,310,000 | 31.9 | +19.3% | 1.93 |
| 30 | Georgia | 616,000 | 1,938,000 | 31.8 | +0.2% | 1.92 |
| 31 | Montana | 95,000 | 301,000 | 31.6 | -3.1% | 1.75 |
| 32 | New Mexico | 113,000 | 363,000 | 31.1 | -0.9% | 1.84 |
| 33 | Hawaii | 72,000 | 233,000 | 30.9 | -4.0% | 2.00 |
| 34 | Arkansas | 170,000 | 552,000 | 30.8 | -0.6% | 1.95 |
| 35 | Minnesota | 324,000 | 1,054,000 | 30.7 | +5.2% | 2.03 |
| 36 | Iowa | 200,000 | 653,000 | 30.6 | +5.8% | 1.90 |
| 37 | Maryland | 304,000 | 1,000,000 | 30.4 | -18.1% | 2.03 |
| 38 | Louisiana | 268,000 | 897,000 | 29.9 | -11.8% | 2.12 |
| 39 | Texas | 1,679,000 | 5,620,000 | 29.9 | +1.3% | 2.23 |
| 40 | Oklahoma | 219,000 | 737,000 | 29.7 | -3.1% | 2.21 |
| 41 | Delaware | 64,000 | 216,000 | 29.6 | +1.6% | 2.09 |
| 42 | Missouri | 317,000 | 1,090,000 | 29.1 | -7.0% | 2.30 |
| 43 | Arizona | 388,000 | 1,335,000 | 29.1 | -11.6% | 2.10 |
| 44 | Alabama | 240,000 | 839,000 | 28.6 | -4.8% | 2.21 |
| 45 | Oregon | 230,000 | 807,000 | 28.5 | -4.6% | 2.10 |
| 46 | Mississippi | 151,000 | 533,000 | 28.3 | +8.6% | 2.22 |
| 47 | South Carolina | 326,000 | 1,156,000 | 28.2 | +1.2% | 2.06 |
| 48 | North Carolina | 581,000 | 2,084,000 | 27.9 | -7.5% | 2.30 |
| 49 | Wyoming | 44,000 | 158,000 | 27.8 | +0.0% | 1.98 |
| 50 | Alaska | 56,000 | 209,000 | 26.8 | -5.1% | 1.95 |
| 51 | West Virginia | 84,000 | 320,000 | 26.2 | -7.7% | 2.33 |
Source data: BLS State JOLTS annual estimates, released July 22, 2026 (Tables 13, 17 and 19). Index, changes and ratios computed by RemoteLaws. State links go to each state’s unemployment benefits guide. Quits per layoff above 1 means more workers left voluntarily than were let go, usually a sign of a confident labor market.
Where layoffs rose the most
Cite this chart (APA, MLA, HTML) and embed code
APA: RemoteLaws. (2026, November 21). Where layoffs rose the most in 2025 [Chart]. Data from Computed by RemoteLaws from BLS State JOLTS Table 19. https://remotelaws.com/statistics/layoffs/
MLA: “Where layoffs rose the most in 2025.” RemoteLaws, 21 Nov. 2026, https://remotelaws.com/statistics/layoffs/. Chart; data from Computed by RemoteLaws from BLS State JOLTS Table 19.
HTML link with attribution:
Embed this chart:
Download state data 2021-2025 (CSV) Includes the index and every ratio, each labeled Computed by RemoteLaws.
Layoffs per Year: 2021 to 2025

Cite this chart (APA, MLA, HTML) and embed code
APA: RemoteLaws. (2026, November 21). US layoffs and discharges per year, 2021-2025 [Chart]. Data from U.S. Bureau of Labor Statistics, JOLTS Table 23. https://remotelaws.com/statistics/layoffs/
MLA: “US layoffs and discharges per year, 2021-2025.” RemoteLaws, 21 Nov. 2026, https://remotelaws.com/statistics/layoffs/. Chart; data from U.S. Bureau of Labor Statistics, JOLTS Table 23.
HTML link with attribution:
Embed this chart:
| Year | Layoffs and discharges | Change from prior year |
|---|---|---|
| 2021 | 17,104 | |
| 2022 | 17,644 | +540 (Computed by RemoteLaws) |
| 2023 | 19,847 | +2,203 (Computed by RemoteLaws) |
| 2024 | 20,014 | +167 (Computed by RemoteLaws) |
| 2025 | 21,239 | +1,225 (Computed by RemoteLaws) |
Source: BLS JOLTS, Table 23. The annual level is the sum of the 12 monthly levels, so one person laid off twice counts twice.
Monthly Layoffs: Latest Months, Preliminary vs Revised
| Month | Level | Rate | Status |
|---|---|---|---|
| Sept. 2025 | 1,816,000 | 1.1% | Revised |
| June 2026 | 1,785,000 | 1.1% | Revised |
| July 2026 | 1,702,000 | 1.1% | Revised |
| Aug. 2026 | 1,768,000 | 1.1% | Revised |
| Sept. 2026 | 1,641,000 | 1.0% | Preliminary (p) |
BLS publishes each month as preliminary and revises it the following month, then again in the annual revision with January data. The September 2026 figure is preliminary and will be revised in the release scheduled for December 1, 2026 (BLS schedule).
Source: BLS JOLTS release of November 3, 2026, Table 5.
Layoffs by Industry (September 2026)
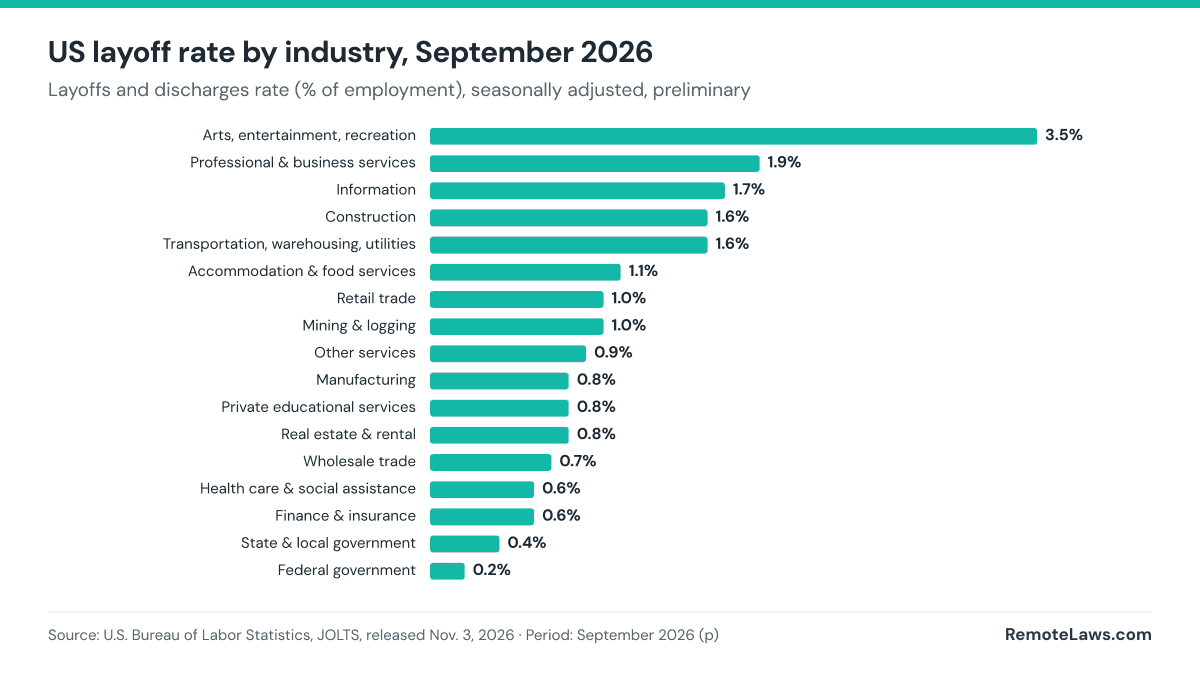

Cite this chart (APA, MLA, HTML) and embed code
APA: RemoteLaws. (2026, November 21). US layoff rate by industry, September 2026 [Chart]. Data from U.S. Bureau of Labor Statistics, JOLTS (Nov. 3, 2026 release). https://remotelaws.com/statistics/layoffs/
MLA: “US layoff rate by industry, September 2026.” RemoteLaws, 21 Nov. 2026, https://remotelaws.com/statistics/layoffs/. Chart; data from U.S. Bureau of Labor Statistics, JOLTS (Nov. 3, 2026 release).
HTML link with attribution:
Embed this chart:
| Industry | Layoffs and discharges | Rate |
|---|---|---|
| Professional & business services | 419,000 | 1.9% |
| Health care & social assistance | 154,000 | 0.6% |
| Accommodation & food services | 151,000 | 1.1% |
| Retail trade | 151,000 | 1.0% |
| Construction | 138,000 | 1.6% |
| Transportation, warehousing, utilities | 113,000 | 1.6% |
| Manufacturing | 99,000 | 0.8% |
| Arts, entertainment, recreation | 92,000 | 3.5% |
| State & local government | 78,000 | 0.4% |
| Other services | 57,000 | 0.9% |
| Information | 46,000 | 1.7% |
| Wholesale trade | 43,000 | 0.7% |
| Finance & insurance | 39,000 | 0.6% |
| Private educational services | 32,000 | 0.8% |
| Real estate & rental | 19,000 | 0.8% |
| Mining & logging | 6,000 | 1.0% |
| Federal government | 5,000 | 0.2% |
Download the data (CSV) Every row carries its series, period, seasonal adjustment, status, source and release date.
Methodology: What These Layoff Numbers Measure
- Layoffs and discharges are involuntary separations initiated by the employer: layoffs with no intent to rehire, layoffs over 7 days, firings, and the end of temporary or seasonal jobs. They come from the Job Openings and Labor Turnover Survey (JOLTS), a monthly sample of about 21,000 business and government establishments (BLS JOLTS FAQ).
- Number vs rate: the level counts separations in the month; the rate divides them by employment. A rising level can come with a flat rate when employment grows.
- JOLTS vs WARN notices: WARN notices are advance warnings that some employers must file before mass layoffs or plant closings (U.S. DOL WARN). They cover planned events at larger employers only, are counted by announcement date, and include layoffs that may never happen. They are not comparable with JOLTS, which estimates all employer-initiated separations actually made in a month.
- JOLTS vs news “layoff trackers”: trackers that count announced job cuts measure announcements, not separations, and are not official statistics.
- Seasonal adjustment: monthly figures on this page are seasonally adjusted; annual totals are not, because BLS publishes annual sums from unadjusted data.
- Publication date vs period: the November 3, 2026 release covers September 2026. The next release, scheduled for December 1, 2026, will add October 2026 and revise September (BLS schedule).
How to Cite This Page and Reuse the Data
Free to use under CC BY 4.0. Journalists, researchers, bloggers and AI tools may quote any figure, ranking, index or chart on this page, including the indices computed by RemoteLaws, as long as they credit RemoteLaws with a link to this page. The underlying official data stay credited to their agencies.
Need a state breakdown, a custom chart or an expert comment? Contact the RemoteLaws Research Team.
APA: RemoteLaws Research Team. (2026, November 21). US Layoff Statistics 2026-2027 and the RemoteLaws Layoff Pressure Index. RemoteLaws. https://remotelaws.com/statistics/layoffs/
MLA: RemoteLaws Research Team. “US Layoff Statistics 2026-2027 and the RemoteLaws Layoff Pressure Index.” RemoteLaws, 21 Nov. 2026, https://remotelaws.com/statistics/layoffs/.
HTML link with attribution:
Frequently Asked Questions
Which state has the most layoffs?
By number, California (2,439,000 layoffs and discharges in 2025), then Texas and New York. Relative to hiring, Idaho ranked first on the RemoteLaws Layoff Pressure Index with 62.6 layoffs per 100 hires (Computed by RemoteLaws from BLS State JOLTS).
What is the RemoteLaws Layoff Pressure Index?
Layoffs and discharges divided by hires in the same state and year, times 100. The U.S. figure was 33.7 in 2025. It is computed by RemoteLaws from official BLS State JOLTS annual levels and can be cited with a link to this page.
How many people were laid off in the US in 2025?
BLS JOLTS counts 21.2 million layoffs and discharges in 2025 (21,239,000), the sum of 12 monthly levels. That counts separations, not people: someone laid off twice counts twice.
How many layoffs were there in September 2026?
About 1.6 million (1,641,000), a rate of 1.0% of employment, seasonally adjusted. The figure is preliminary and will be revised in the December 1, 2026 release.
Are layoffs going up in 2026?
Monthly layoffs in 2026 have stayed between 1.6 and 1.8 million in the months shown here, at a rate of 1.0% to 1.1%. September 2026 was 175,000 below September 2025 (Computed by RemoteLaws from BLS JOLTS).
Which industry has the most layoffs?
In September 2026, professional and business services had the most layoffs and discharges (419,000). Arts, entertainment and recreation had the highest rate (3.5%).
What is the difference between JOLTS layoffs and WARN notices?
JOLTS estimates all employer-initiated separations actually made each month across the economy. WARN notices are advance filings by larger employers for planned mass layoffs or closings, so they cover far fewer events and some never take place.
What is the layoff rate?
The number of layoffs and discharges during the month as a percent of employment. It was 1.0% in September 2026 (preliminary).
Sources, Methodology Notes & Update Log
- Monthly and industry data: BLS JOLTS release of November 3, 2026 (September 2026 data), Tables 4 and 5, read November 21, 2026.
- State data: BLS State JOLTS annual estimates, released July 22, 2026 (Tables 13, 17 and 19), read November 21, 2026. The state tables cover calendar 2025 (the latest annual state estimates).
- Annual national data: BLS JOLTS Table 23 and the March 13, 2026 release (annual shares of separations).
- Definitions: BLS JOLTS FAQ. Release schedule: BLS. WARN: U.S. DOL.
- Computed by RemoteLaws: the Layoff Pressure Index (layoffs per 100 hires), state changes 2024-2025, quits per layoff, layoffs per minute, year-over-year changes and the quits-to-layoffs ratio. No figure on this page is estimated.
- Update log: November 21, 2026, page created; same day, state rankings and RemoteLaws indices added. Next update after the December 1, 2026 JOLTS release.