
US Minimum Wage Statistics — Original RemoteLaws analysis of official data — Updated November 21, 2026
US Minimum Wage Statistics 2026-2027: Every State Ranked by What the Minimum Wage Buys
The federal minimum wage has been $7.25 since 2009, but on January 1, 2027, 30 states and DC will pay more (including 19 states and DC at $15 or more), while 20 states stay at $7.25. 844,000 hourly workers earned $7.25 or less in 2025. This page ranks all 50 states and DC by the RemoteLaws Real Minimum Wage, adjusted for local prices, shows who earns the minimum wage and gives every figure with its official source, charts and free CSV files.

By the RemoteLaws Research Team · Published November 21, 2026 · Latest data: 2025 (BLS national tables); 2024 (BLS by state, BEA prices); rates on January 1, 2026 and 2027 · Next update: after the BLS 2025 report and BEA 2025 price parities (December 10, 2026)
Key Minimum Wage Statistics 2026-2027 (Latest Data and RemoteLaws Indices)
- 844,000 US workers were paid at or below the federal minimum wage of $7.25 in 2025: 79,000 exactly at it and 765,000 below it. That is 1.0% of the 81.5 million workers paid by the hour. BLS CPS table 44, 2025 annual average (11 months, October not collected) (source)
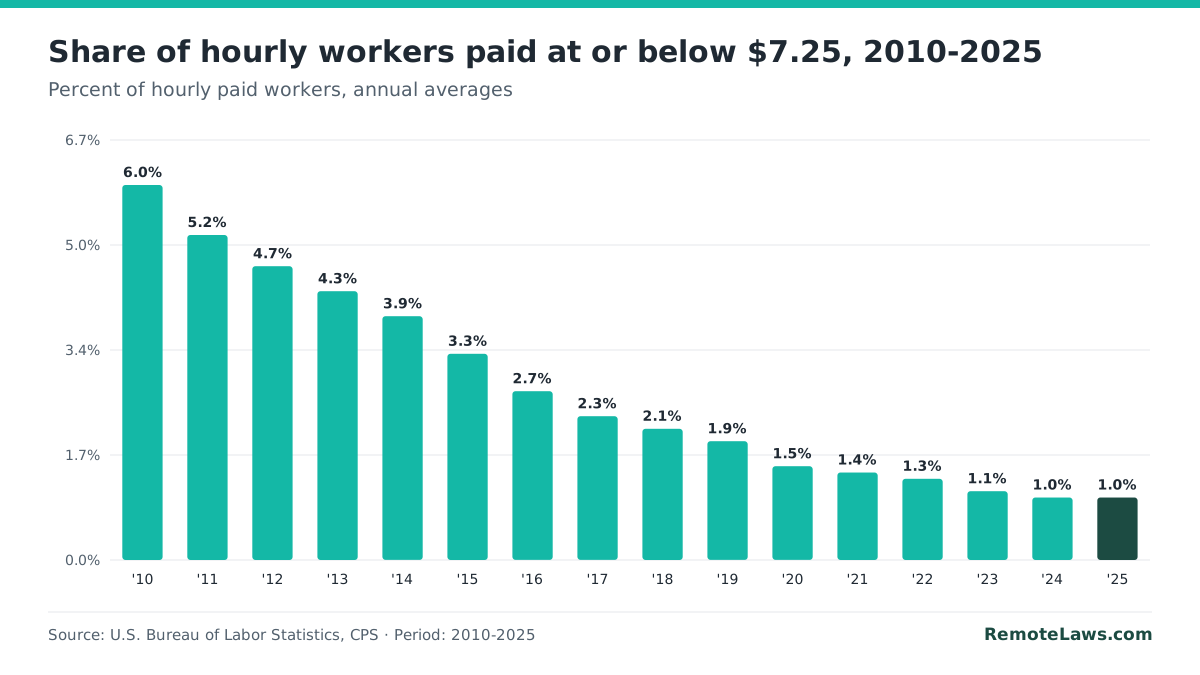
- The number is down 81% from 4,361,000 (6.0% of hourly workers) in 2010, as states raised their own minimums above $7.25. Computed by RemoteLaws from BLS, Characteristics of minimum wage workers, 2024 (Table 10) and CPS table 44 (source)
- The federal minimum wage has been $7.25 since July 24, 2009; on January 1, 2027 it will have gone more than 17 years without a raise. U.S. Department of Labor (source)
- On January 1, 2027, 30 states and DC will have a minimum wage above $7.25 and 20 states will still use $7.25. 16 states raise their rate on January 1, 2027, and 19 states and DC will be at $15 or more. Computed by RemoteLaws from state labor agency notices and the U.S. DOL state minimum wage table, verified November 16-19, 2026
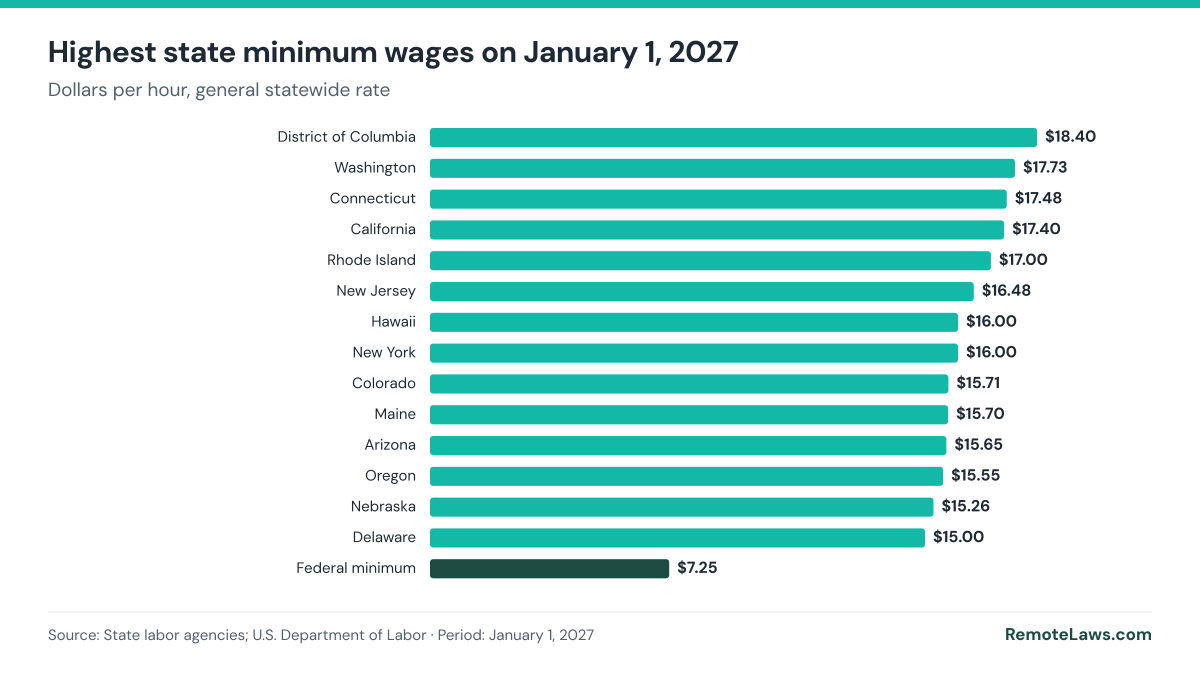
- The highest statewide minimum wages on January 1, 2027: District of Columbia $18.40, Washington $17.73, Connecticut $17.48, California $17.40 and Rhode Island $17.00. DC’s rate is 2.5 times the federal minimum. State labor agencies; ratio Computed by RemoteLaws
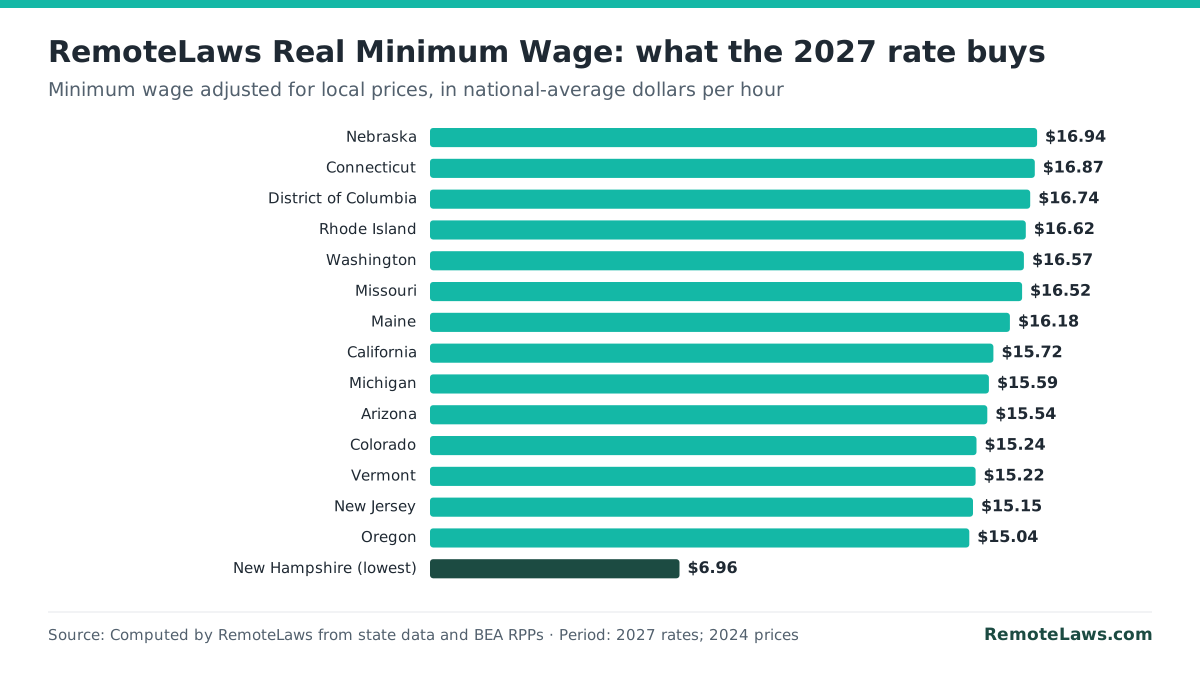
- RemoteLaws Real Minimum Wage: adjusted for local prices, Nebraska’s 2027 minimum wage buys the most ($16.94 in national-average dollars), ahead of Connecticut ($16.87) and the District of Columbia ($16.74). In New Hampshire, $7.25 is worth just $6.96. Computed by RemoteLaws from state minimum wages and BEA regional price parities, 2024
- A full-time worker at $7.25 earns $15,080 a year; at DC’s 2027 rate, $38,272. Computed by RemoteLaws: hourly rate × 2,080 hours
- In the 20 states at $7.25, 1.5% of hourly workers earned $7.25 or less in 2024, against 0.8% elsewhere; those states were home to 53% of all such workers. Computed by RemoteLaws from BLS, Characteristics of minimum wage workers, 2024 (Table 3) (source)
- Part-time workers were 4 times as likely as full-time workers to earn $7.25 or less in 2025 (2.4% vs 0.6%), and women more likely than men (1.3% vs 0.7%). BLS CPS table 44, 2025 (source); ratio Computed by RemoteLaws
- 66% of workers at or below $7.25 worked in leisure and hospitality in 2025, where the rate reached 5.7%; in food preparation and serving jobs it was 7.5%, a group where many workers are tipped and the BLS hourly wage leaves tips out. BLS CPS table 45, 2025 (source); share Computed by RemoteLaws
Each line can be quoted as written. Please link to this page and keep the source and period. Lines marked Computed by RemoteLaws are original RemoteLaws calculations from official data.
Minimum Wage by State 2026 vs 2027: All 50 States and DC Ranked
Nominal rates tell only half the story: $15 does not buy the same thing in Missouri as in California. The RemoteLaws Real Minimum Wage divides each state’s January 1, 2027 rate by its regional price parity from the Bureau of Economic Analysis, which measures how much more or less expensive the state is than the national average. The result is the minimum wage in national-average dollars, so states can be compared fairly.

Cite this chart (APA, MLA, HTML) and embed code
APA: RemoteLaws. (2026, November 21). RemoteLaws Real Minimum Wage: what the 2027 rate buys [Chart]. Data from Computed by RemoteLaws from state minimum wages and BEA regional price parities (2024). https://remotelaws.com/statistics/minimum-wage/
MLA: “RemoteLaws Real Minimum Wage: what the 2027 rate buys.” RemoteLaws, 21 Nov. 2026, https://remotelaws.com/statistics/minimum-wage/. Chart; data from Computed by RemoteLaws from state minimum wages and BEA regional price parities (2024).
HTML link with attribution:
Embed this chart:
| Rank | State | Jan. 1, 2026 | Jan. 1, 2027 | Change | Real Minimum Wage 2027 | Price level (U.S. = 100) | Full-time pay 2027 | Hourly workers at or below $7.25 (2024) | Note |
|---|---|---|---|---|---|---|---|---|---|
| 1 | Nebraska | $15.00 | $15.26 | +$0.26 | $16.94 | 90.1 | $31,741 | 0.7% | youth and training wages since July 18, 2026 |
| 2 | Connecticut | $16.94 | $17.48 | +$0.54 | $16.87 | 103.6 | $36,358 | 0.9% | |
| 3 | District of Columbia | $17.95 | $18.40 | +$0.45 | $16.74 | 109.9 | $38,272 | 0.9% | raised on July 1, 2026; adjusts each July 1 |
| 4 | Rhode Island | $16.00 | $17.00 | +$1.00 | $16.62 | 102.3 | $35,360 | 0.8% | |
| 5 | Washington | $17.13 | $17.73 | +$0.60 | $16.57 | 107.0 | $36,878 | 0.6% | |
| 6 | Missouri | $15.00 | $15.00 | — | $16.52 | 90.8 | $31,200 | 0.7% | |
| 7 | Maine | $15.10 | $15.70 | +$0.60 | $16.18 | 97.0 | $32,656 | 1.2% | |
| 8 | California | $16.90 | $17.40 | +$0.50 | $15.72 | 110.7 | $36,192 | 0.4% | |
| 9 | Michigan | $13.73 | $15.00 | +$1.27 | $15.59 | 96.2 | $31,200 | 0.9% | Jan. 1, 2027 step under the 2025 amendments |
| 10 | Arizona | $15.15 | $15.65 | +$0.50 | $15.54 | 100.7 | $32,552 | 0.3% | |
| 11 | Colorado | $15.16 | $15.71 | +$0.55 | $15.24 | 103.1 | $32,677 | 0.1% | |
| 12 | Vermont | $14.42 | $14.91 | +$0.49 | $15.22 | 98.0 | $31,013 | 1.0% | |
| 13 | New Jersey | $15.92 | $16.48 | +$0.56 | $15.15 | 108.8 | $34,278 | 0.9% | |
| 14 | Oregon | $15.05 | $15.55 | +$0.50 | $15.04 | 103.4 | $32,344 | 0.7% | standard rate; Portland metro $16.80, nonurban $14.55 (since July 1, 2026) |
| 15 | Delaware | $15.00 | $15.00 | — | $15.03 | 99.8 | $31,200 | 1.6% | |
| 16 | Illinois | $15.00 | $15.00 | — | $15.01 | 100.0 | $31,200 | 0.7% | |
| 17 | New York | $16.00 | $16.00 | — | $14.83 | 107.9 | $33,280 | 0.9% | $17.00 in New York City, Long Island and Westchester |
| 18 | Hawaii | $16.00 | $16.00 | — | $14.55 | 110.0 | $33,280 | 0.6% | |
| 19 | Florida | $14.00 | $15.00 | +$1.00 | $14.50 | 103.4 | $31,200 | 1.0% | raised on September 30, 2026 |
| 20 | Maryland | $15.00 | $15.00 | — | $14.29 | 105.0 | $31,200 | 0.7% | |
| 21 | Massachusetts | $15.00 | $15.00 | — | $14.18 | 105.8 | $31,200 | 0.8% | |
| 22 | South Dakota | $11.85 | $12.30 | +$0.45 | $13.88 | 88.6 | $25,584 | 1.1% | |
| 23 | Alaska | $13.00 | $14.00 | +$1.00 | $13.68 | 102.4 | $29,120 | 0.5% | $15.00 from July 1, 2027 |
| 24 | Virginia | $12.77 | $13.75 | +$0.98 | $13.60 | 101.1 | $28,600 | 1.8% | |
| 25 | New Mexico | $12.00 | $12.00 | — | $13.01 | 92.2 | $24,960 | 0.9% | |
| 26 | Arkansas | $11.00 | $11.00 | — | $12.65 | 86.9 | $22,880 | 1.3% | |
| 27 | Ohio | $11.00 | $11.40 | +$0.40 | $12.29 | 92.8 | $23,712 | 1.6% | $7.25 for small employers and workers under 16 |
| 28 | Minnesota | $11.41 | $11.87 | +$0.46 | $12.04 | 98.6 | $24,690 | 0.4% | |
| 29 | Nevada | $12.00 | $12.00 | — | $12.00 | 100.0 | $24,960 | 0.7% | |
| 30 | Montana | $10.85 | $11.20 | +$0.35 | $11.83 | 94.6 | $23,296 | 0.8% | |
| 31 | West Virginia | $8.75 | $8.75 | — | $9.78 | 89.5 | $18,200 | 1.6% | |
| 32 | Mississippi | $7.25 | $7.25 | — | $8.34 | 87.0 | $15,080 | 1.5% | |
| 33 | Iowa | $7.25 | $7.25 | — | $8.26 | 87.8 | $15,080 | 0.7% | |
| 34 | Oklahoma | $7.25 | $7.25 | — | $8.25 | 87.8 | $15,080 | 1.7% | |
| 35 | Louisiana | $7.25 | $7.25 | — | $8.22 | 88.2 | $15,080 | 2.2% | |
| 36 | Alabama | $7.25 | $7.25 | — | $8.16 | 88.8 | $15,080 | 1.1% | |
| 37 | North Dakota | $7.25 | $7.25 | — | $8.15 | 89.0 | $15,080 | 0.6% | |
| 38 | Kansas | $7.25 | $7.25 | — | $8.05 | 90.1 | $15,080 | 1.2% | |
| 39 | Kentucky | $7.25 | $7.25 | — | $8.04 | 90.2 | $15,080 | 1.6% | |
| 40 | Tennessee | $7.25 | $7.25 | — | $7.89 | 91.9 | $15,080 | 0.9% | |
| 41 | Wyoming | $7.25 | $7.25 | — | $7.82 | 92.7 | $15,080 | 0.8% | state law $5.15; federal $7.25 applies to most jobs |
| 42 | Indiana | $7.25 | $7.25 | — | $7.77 | 93.3 | $15,080 | 1.5% | |
| 43 | South Carolina | $7.25 | $7.25 | — | $7.73 | 93.7 | $15,080 | 2.0% | |
| 44 | Wisconsin | $7.25 | $7.25 | — | $7.70 | 94.1 | $15,080 | 1.1% | |
| 45 | North Carolina | $7.25 | $7.25 | — | $7.69 | 94.3 | $15,080 | 1.6% | |
| 46 | Idaho | $7.25 | $7.25 | — | $7.59 | 95.5 | $15,080 | 1.2% | |
| 47 | Georgia | $7.25 | $7.25 | — | $7.53 | 96.3 | $15,080 | 1.1% | state law $5.15; federal $7.25 applies to most jobs |
| 48 | Texas | $7.25 | $7.25 | — | $7.47 | 97.1 | $15,080 | 1.7% | |
| 49 | Pennsylvania | $7.25 | $7.25 | — | $7.43 | 97.6 | $15,080 | 1.5% | |
| 50 | Utah | $7.25 | $7.25 | — | $7.33 | 98.9 | $15,080 | 1.4% | |
| 51 | New Hampshire | $7.25 | $7.25 | — | $6.96 | 104.2 | $15,080 | 1.2% |
Rates: general statewide minimum wage in effect on January 1 of each year, from each state’s labor agency (links in the CSV and on each state page) and the U.S. DOL state table, verified November 16-19, 2026. Price levels: BEA regional price parities, 2024. Workers at or below $7.25: BLS, 2024, Table 3 (sample-based, large error for small states). Real Minimum Wage, change and full-time pay (× 2,080 hours) Computed by RemoteLaws. Local rates (cities and counties) can be higher; state links go to each state’s minimum wage guide.
Highest minimum wages in 2027 (nominal)
Cite this chart (APA, MLA, HTML) and embed code
APA: RemoteLaws. (2026, November 21). Highest state minimum wages on January 1, 2027 [Chart]. Data from State labor agencies; U.S. Department of Labor. https://remotelaws.com/statistics/minimum-wage/
MLA: “Highest state minimum wages on January 1, 2027.” RemoteLaws, 21 Nov. 2026, https://remotelaws.com/statistics/minimum-wage/. Chart; data from State labor agencies; U.S. Department of Labor.
HTML link with attribution:
Embed this chart:
Download state data 2026-2027 (CSV) Every rate carries its official source.
Who Earns the Minimum Wage? Workers at or Below $7.25 (2025)
| Group | Paid hourly | Below $7.25 | At $7.25 | At or below | Share of hourly workers |
|---|---|---|---|---|---|
| Total, 16 and over | 81,548 | 765 | 79 | 844 | 1.0% |
| 16 to 24 years | 16,202 | 292 | 48 | 340 | 2.1% |
| 25 years and over | 65,347 | 473 | 31 | 504 | 0.8% |
| Men | 40,714 | 257 | 42 | 299 | 0.7% |
| Women | 40,835 | 508 | 37 | 545 | 1.3% |
| White | 60,534 | 577 | 62 | 639 | 1.1% |
| Black or African American | 12,317 | 97 | 14 | 111 | 0.9% |
| Asian | 4,719 | 33 | 2 | 35 | 0.7% |
| Hispanic or Latino | 19,717 | 169 | 20 | 189 | 1.0% |
| Full-time workers | 61,107 | 330 | 28 | 358 | 0.6% |
| Part-time workers | 20,344 | 432 | 50 | 483 | 2.4% |
Workers under 25 were 20% of hourly workers but 40% of those at or below $7.25 (Computed by RemoteLaws). Most were part-time: 483,000 of the 844,000.
Source: BLS CPS table 44, 2025. 2025 figures are 11-month averages because October 2025 was not collected during the federal shutdown, so BLS says they are not strictly comparable with other years.
| Occupation or industry | Paid hourly (thousands) | At or below $7.25 (thousands) | Share |
|---|---|---|---|
| Food preparation and serving (occupation) | 7,180 | 536 | 7.5% |
| Food services and drinking places | 7,317 | 515 | 7.0% |
| Leisure and hospitality | 9,702 | 555 | 5.7% |
| Service occupations | 19,845 | 651 | 3.3% |
| Other services | 3,315 | 38 | 1.1% |
| Information | 769 | 4 | 0.6% |
| Transportation and utilities | 4,515 | 23 | 0.5% |
| Retail trade | 11,166 | 46 | 0.4% |
| Education and health services | 15,139 | 57 | 0.4% |
| Professional and business services | 6,980 | 27 | 0.4% |
| Public sector | 10,128 | 41 | 0.4% |
| Manufacturing | 8,440 | 26 | 0.3% |
| Construction | 5,655 | 11 | 0.2% |
| Financial activities | 3,248 | 1 | 0.0% |
Source: BLS CPS table 45, 2025.
Minimum Wage Workers Over Time: 2010 to 2025

Cite this chart (APA, MLA, HTML) and embed code
APA: RemoteLaws. (2026, November 21). Share of hourly workers paid at or below $7.25, 2010-2025 [Chart]. Data from U.S. Bureau of Labor Statistics, Characteristics of Minimum Wage Workers and CPS table 44. https://remotelaws.com/statistics/minimum-wage/
MLA: “Share of hourly workers paid at or below $7.25, 2010-2025.” RemoteLaws, 21 Nov. 2026, https://remotelaws.com/statistics/minimum-wage/. Chart; data from U.S. Bureau of Labor Statistics, Characteristics of Minimum Wage Workers and CPS table 44.
HTML link with attribution:
Embed this chart:
| Year | At or below $7.25 (thousands) | Share of hourly workers |
|---|---|---|
| 2025 | 844 | 1.0% |
| 2024 | 843 | 1.0% |
| 2023 | 869 | 1.1% |
| 2022 | 1,023 | 1.3% |
| 2021 | 1,091 | 1.4% |
| 2020 | 1,112 | 1.5% |
| 2019 | 1,603 | 1.9% |
| 2018 | 1,711 | 2.1% |
| 2017 | 1,824 | 2.3% |
| 2016 | 2,153 | 2.7% |
| 2015 | 2,561 | 3.3% |
| 2014 | 2,992 | 3.9% |
| 2013 | 3,301 | 4.3% |
| 2012 | 3,550 | 4.7% |
| 2011 | 3,829 | 5.2% |
| 2010 | 4,361 | 6.0% |
Sources: BLS, Characteristics of minimum wage workers, 2024, Table 10 (2010-2024) and CPS table 44 (2025). In 1979 the share was 13.4%.
Where the Most Workers Earn $7.25 or Less (2024)
Cite this chart (APA, MLA, HTML) and embed code
APA: RemoteLaws. (2026, November 21). Where the most hourly workers earn $7.25 or less [Chart]. Data from U.S. Bureau of Labor Statistics, Characteristics of Minimum Wage Workers, 2024. https://remotelaws.com/statistics/minimum-wage/
MLA: “Where the most hourly workers earn $7.25 or less.” RemoteLaws, 21 Nov. 2026, https://remotelaws.com/statistics/minimum-wage/. Chart; data from U.S. Bureau of Labor Statistics, Characteristics of Minimum Wage Workers, 2024.
HTML link with attribution:
Embed this chart:
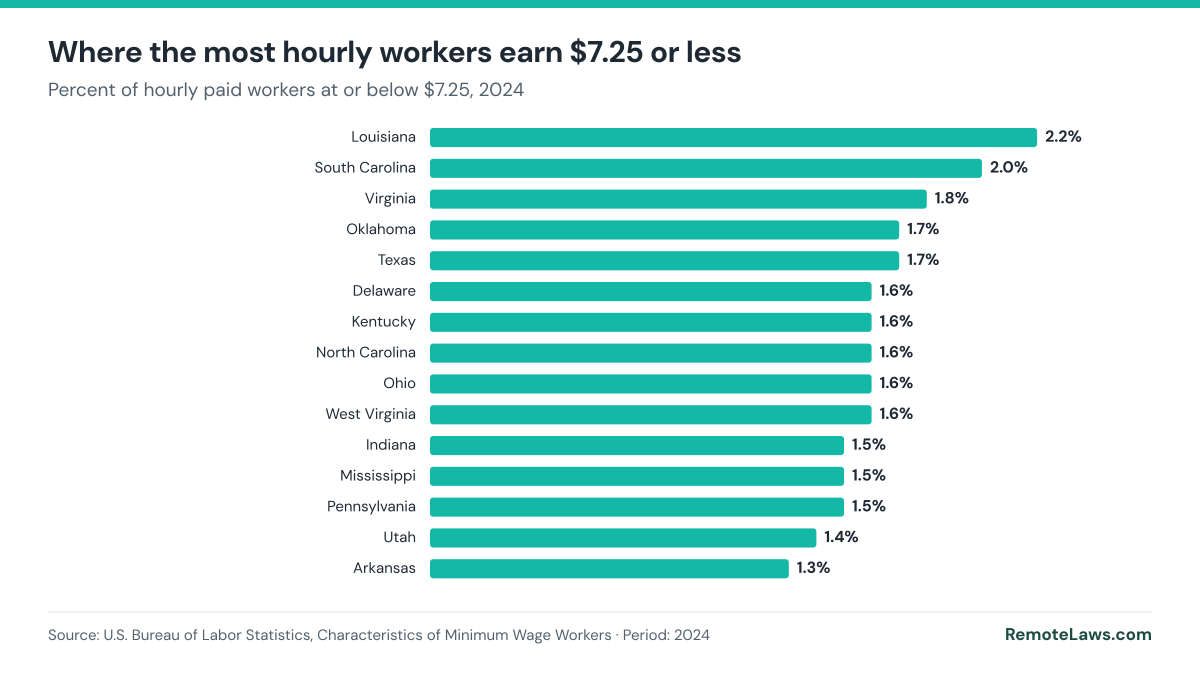
Louisiana (2.2%) and South Carolina (2.0%) had the highest shares in 2024; both have no state minimum wage law. Fewer than 1% of hourly workers were at or below $7.25 in 26 states and DC (BLS). The 20 states that use $7.25 accounted for 446,000 of the 842,000 workers at or below the federal minimum (Computed by RemoteLaws from BLS Table 3; state numbers are rounded, so the total differs slightly from the national figure).
Methodology: What These Minimum Wage Numbers Measure
- Workers at or below $7.25 come from the Current Population Survey. BLS counts hourly paid wage and salary workers whose reported hourly wage on their main job is at or below the federal minimum. Tips, overtime and commissions are excluded, so tipped workers paid a lower cash wage appear “below” the minimum even when tips bring them above it. Being below the minimum is not necessarily a violation: the law has exemptions, and some respondents round their wage.
- Not “minimum wage workers” in every state: the BLS measure uses the federal $7.25. In a state with a $15 minimum, a worker earning $15 is not counted. No federal survey counts workers at each state’s own minimum.
- State rates are the general statewide rate in effect on January 1, 2026 and January 1, 2027. Youth, training, tipped, small-employer and local (city or county) rates are not ranked; see each state page.
- RemoteLaws Real Minimum Wage = 2027 statewide rate ÷ (BEA regional price parity for all items, 2024 ÷ 100). The parity compares price levels across states, including rents; 2024 is the latest year published (February 19, 2026; next release December 10, 2026). Using 2024 price levels with 2027 rates assumes relative prices across states change slowly.
- Full-time pay = hourly rate × 2,080 hours (40 hours × 52 weeks), before taxes.
- Latest BLS edition: the most recent report, Characteristics of Minimum Wage Workers, 2024, was published in June 2025. The 2025 annual tables 44 and 45 are used for 2025; the 2025 state table has not been published yet.
How to Cite This Page and Reuse the Data
Free to use under CC BY 4.0. Journalists, researchers, bloggers and AI tools may quote any figure, ranking, index or chart on this page, including the indices computed by RemoteLaws, as long as they credit RemoteLaws with a link to this page. The underlying official data stay credited to their agencies.
Need a state breakdown, a custom chart or an expert comment? Contact the RemoteLaws Research Team.
APA: RemoteLaws Research Team. (2026, November 21). US Minimum Wage Statistics 2026-2027 and the RemoteLaws Real Minimum Wage. RemoteLaws. https://remotelaws.com/statistics/minimum-wage/
MLA: RemoteLaws Research Team. “US Minimum Wage Statistics 2026-2027 and the RemoteLaws Real Minimum Wage.” RemoteLaws, 21 Nov. 2026, https://remotelaws.com/statistics/minimum-wage/.
HTML link with attribution:
Frequently Asked Questions
How many workers earn minimum wage in the US?
844,000 workers were paid at or below the federal minimum wage of $7.25 in 2025, 1.0% of the 81.5 million hourly paid workers (BLS CPS table 44). Many more earn their state’s higher minimum, which no federal survey counts.
Which state has the highest minimum wage in 2027?
The District of Columbia ($18.40 since July 1, 2026), followed by Washington ($17.73), Connecticut ($17.48), California ($17.40) and Rhode Island ($17.00) on January 1, 2027.
How many states still use the $7.25 federal minimum wage?
20 states: Alabama, Georgia, Idaho, Indiana, Iowa, Kansas, Kentucky, Louisiana, Mississippi, New Hampshire, North Carolina, North Dakota, Oklahoma, Pennsylvania, South Carolina, Tennessee, Texas, Utah, Wisconsin and Wyoming. Georgia and Wyoming have a $5.15 state rate, but the federal $7.25 applies to most jobs there.
Which states raise the minimum wage on January 1, 2027?
16 states: Arizona, California, Colorado, Connecticut, Maine, Michigan, Minnesota, Montana, Nebraska, New Jersey, Ohio, Rhode Island, South Dakota, Vermont, Virginia and Washington. Alaska raises again on July 1, 2027.
Where does the minimum wage go furthest?
On the RemoteLaws Real Minimum Wage, which adjusts the 2027 rate for local prices, Nebraska ranks first ($16.94 in national-average dollars), then Connecticut and the District of Columbia. New Hampshire ranks last among the $7.25 states ($6.96).
When did the federal minimum wage last increase?
On July 24, 2009, when it rose to $7.25 an hour. Congress has not changed it since.
What is the RemoteLaws Real Minimum Wage?
A state’s January 1, 2027 minimum wage divided by its BEA regional price parity (U.S. = 100), so it shows what the rate is worth at national-average prices. It is computed by RemoteLaws and can be cited with a link to this page.
How much does a full-time minimum wage worker earn per year?
$15,080 at the federal $7.25 (2,080 hours), $31,200 at $15.00 and $38,272 at DC’s $18.40, before taxes (Computed by RemoteLaws).
Sources, Methodology Notes & Update Log
- Workers at or below $7.25: BLS CPS table 44 and table 45 (2025), and BLS, Characteristics of minimum wage workers, 2024 (Report 1115, June 2025), Tables 3 and 10, read November 21, 2026.
- State rates: each state’s labor agency (URL per state in the CSV), the RemoteLaws state pages verified November 16-19, 2026, and the U.S. DOL state minimum wage table. DC: Department of Employment Services 2026 notice.
- Price levels: BEA, Real personal consumption expenditures and real personal income by state, 2024 (February 19, 2026), state values from the BEA regional price parity table on FRED.
- Computed by RemoteLaws: the Real Minimum Wage, changes 2026-2027, full-time pay, multiples of the federal minimum, counts of states, shares for $7.25 states and declines since 2010. No figure on this page is estimated.
- Not available yet: the BLS 2025 state table and report (not published as of November 21, 2026). A rent-based index (hours of minimum wage work to pay rent) was not built because HUD publishes fair market rents by metro and county, not by state.
- Update log: November 21, 2026, page created.