
US Wage Theft Statistics — Original RemoteLaws analysis of official data — Updated November 21, 2026
Wage Theft Statistics 2026-2027: $259 Million Recovered, One Worker Every 3 Minutes
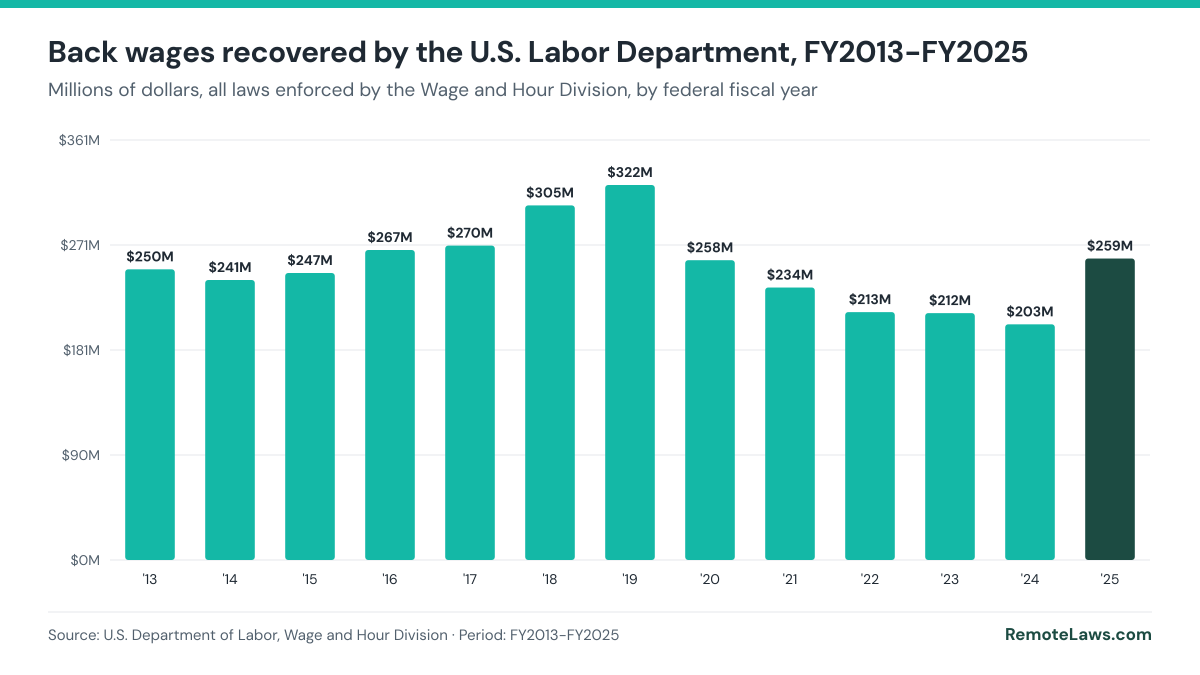
The U.S. Department of Labor recovered $259.3 million in stolen wages for 176,957 workers in fiscal year 2025, about one worker every 3 minutes and $710,000 a day, the most since 2019, even as investigations fell to a 13-year low. This page goes beyond the official totals with a 50-state ranking computed from the Department’s case file, the RemoteLaws Wage Theft Severity Index by industry, recovery per case since 2013, the split between overtime, minimum wage and tip theft, and free charts and CSV files to cite.

By the RemoteLaws Research Team · Published November 21, 2026 · Latest data: Fiscal year 2025 (October 2024 to September 2025) · Next update: when the Wage and Hour Division publishes FY2026 results (usually January)
Key Wage Theft Statistics 2026-2027 (Latest Data and RemoteLaws Indices)
- The U.S. Department of Labor recovered $259,294,764 in back wages for 176,957 workers in fiscal year 2025, an average of $1,465 per worker. U.S. DOL Wage and Hour Division, FY2025 (October 2024 to September 2025) (source)
- That is 27.9% more than in FY2024 ($202,676,115) and the most since FY2019. Computed by RemoteLaws from U.S. DOL WHD All Acts data (source); DOL news release of January 8, 2026 (source)
- About every 3 minutes, federal investigators found another worker who was owed back pay in FY2025, and they recovered about $710,000 a day. Computed by RemoteLaws: 176,957 workers and $259,294,764 over 365 days, from U.S. DOL WHD data
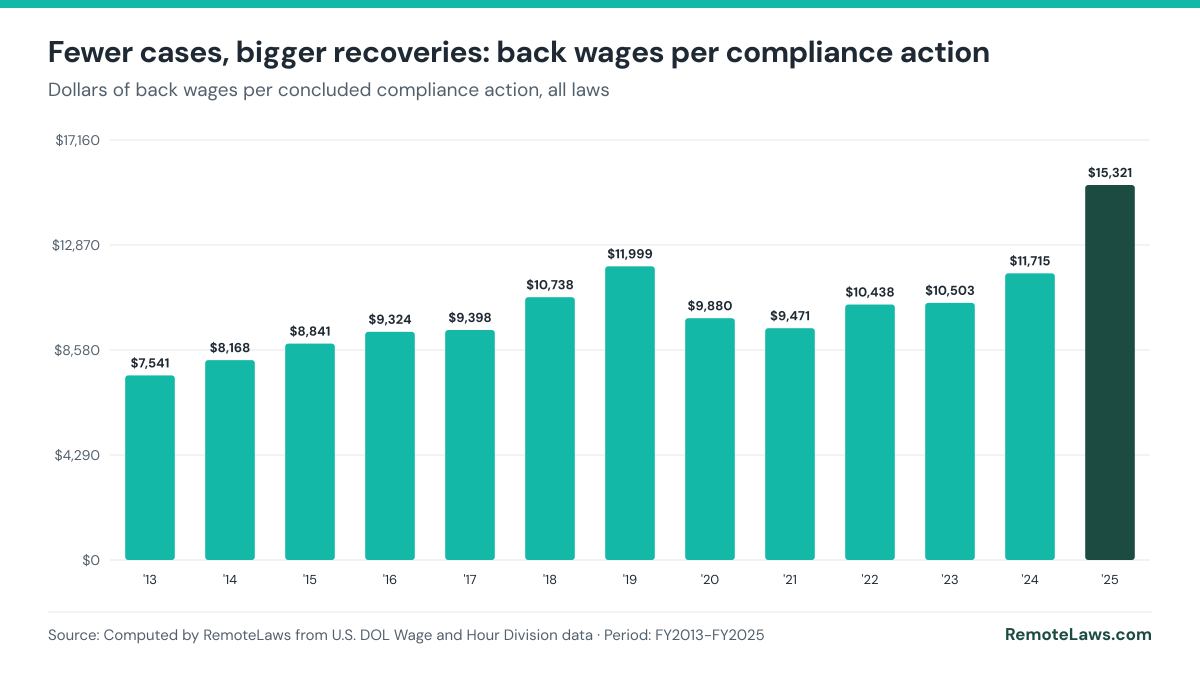
- RemoteLaws Recovery per Case: the Division concluded only 16,924 compliance actions in FY2025, the fewest in the 13 years shown (-48.9% vs FY2013), but each recovered $15,321 on average, about 2.0 times the FY2013 figure ($7,541). Computed by RemoteLaws from U.S. DOL WHD All Acts data, FY2013-FY2025 (source)
- Unpaid overtime is the biggest form of wage theft the agency finds: 79% of Fair Labor Standards Act back wages in FY2025 ($146,377,245 for 110,551 workers). Computed by RemoteLaws from U.S. DOL WHD FLSA data (source)
- Minimum wage back pay nearly doubled: 41,812 workers were owed $27,530,083 for minimum wage violations in FY2025, against 21,543 workers in FY2024 (+94%). Computed by RemoteLaws from U.S. DOL WHD FLSA data (source)
- Tip theft cases reached a record in the series: $10,038,287 in tip-related back wages for 13,469 workers in FY2025, up 35% in a year and from $189,332 in FY2019. U.S. DOL WHD FLSA data, FY2016-FY2025 (source); changes Computed by RemoteLaws
- Civil money penalties assessed on employers hit $58,699,936 in FY2025, +63% in a year and the highest in the FY2013-FY2025 series. U.S. DOL WHD All Acts data (source); change Computed by RemoteLaws
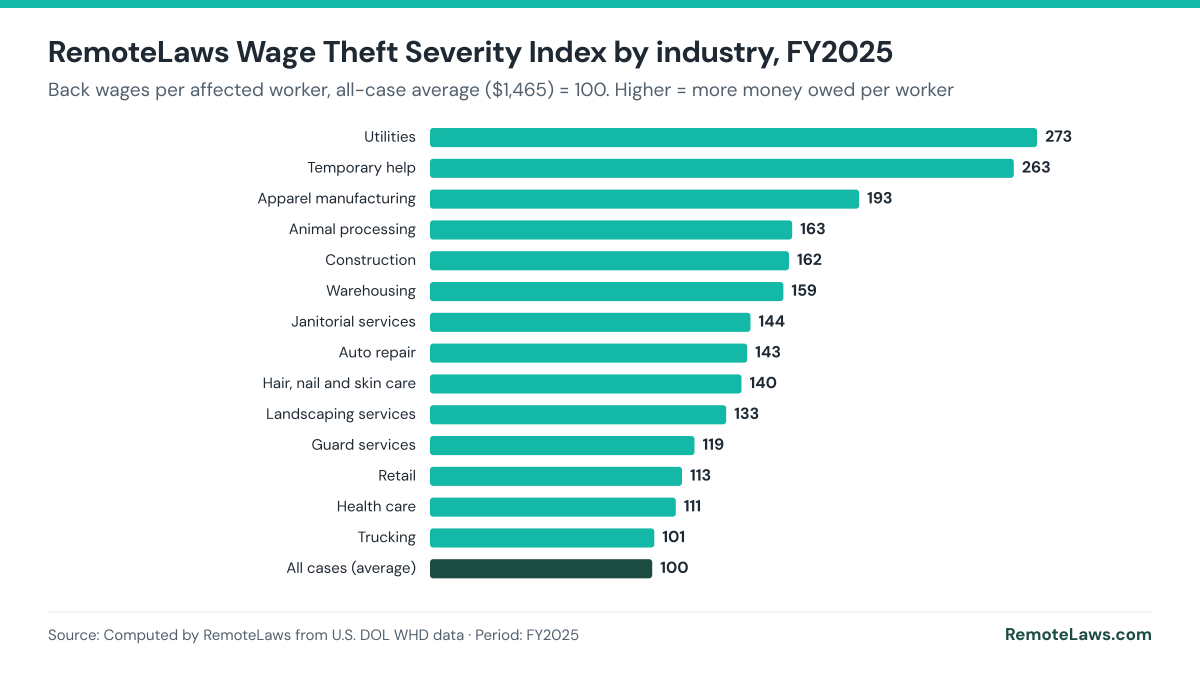
- RemoteLaws Wage Theft Severity Index: workers in utilities were owed the most per person in FY2025 ($4,004, index 273), followed by temporary help ($3,850) and apparel manufacturing ($2,830); child care workers were owed the least ($322). Computed by RemoteLaws from U.S. DOL WHD low-wage, high-violation industry data (source)
- RemoteLaws Federal Wage Recovery Index: over FY2024-FY2025, federal investigators recovered the most back wages per worker in the District of Columbia ($37,915 per 1,000 hourly workers), Hawaii ($12,454) and Virginia ($7,595), against $3,631 for the 50 states and DC. Computed by RemoteLaws from U.S. DOL WHD case data and BLS (source); measures federal recoveries, not how much wage theft occurs
- Health care had the most back wages of any industry tracked ($53.3 million for 32,884 workers); food services had the most cases (4,088) and the largest civil money penalties ($23.1 million). U.S. DOL WHD, FY2025 (source)
Each line can be quoted as written. Please link to this page and keep the source and period. Lines marked Computed by RemoteLaws are original RemoteLaws calculations from official U.S. Department of Labor data. “Wage theft” is used here for back wages the Department found owed; the agency itself speaks of back wages and violations.
Back Wages Recovered per Year: FY2013 to FY2025

Cite this chart (APA, MLA, HTML) and embed code
APA: RemoteLaws. (2026, November 21). Back wages recovered by the U.S. Labor Department, FY2013-FY2025 [Chart]. Data from U.S. Department of Labor, Wage and Hour Division. https://remotelaws.com/statistics/wage-theft/
MLA: “Back wages recovered by the U.S. Labor Department, FY2013-FY2025.” RemoteLaws, 21 Nov. 2026, https://remotelaws.com/statistics/wage-theft/. Chart; data from U.S. Department of Labor, Wage and Hour Division.
HTML link with attribution:
Embed this chart:
| Fiscal year | Compliance actions | Back wages | Workers owed back wages | Civil money penalties | Back wages per worker (Computed by RemoteLaws) |
|---|---|---|---|---|---|
| FY2025 | 16,924 | $259,294,764 | 176,957 | $58,699,936 | $1,465 |
| FY2024 | 17,300 | $202,676,115 | 151,989 | $35,920,310 | $1,333 |
| FY2023 | 20,215 | $212,325,391 | 163,768 | $25,834,687 | $1,297 |
| FY2022 | 20,422 | $213,161,638 | 152,970 | $21,613,896 | $1,393 |
| FY2021 | 24,746 | $234,362,486 | 193,796 | $20,399,042 | $1,209 |
| FY2020 | 26,096 | $257,829,604 | 229,934 | $17,871,969 | $1,121 |
| FY2019 | 26,876 | $322,490,774 | 313,941 | $19,522,169 | $1,027 |
| FY2018 | 28,397 | $304,914,114 | 265,027 | $15,741,194 | $1,151 |
| FY2017 | 28,771 | $270,403,906 | 240,608 | $13,810,028 | $1,124 |
| FY2016 | 28,589 | $266,566,178 | 283,677 | $14,761,891 | $940 |
| FY2015 | 27,914 | $246,780,891 | 240,340 | $12,231,179 | $1,027 |
| FY2014 | 29,483 | $240,831,606 | 270,570 | $12,416,855 | $890 |
| FY2013 | 33,146 | $249,954,412 | 269,250 | $16,169,087 | $928 |
Source: U.S. DOL Wage and Hour Division, All Acts data. Federal fiscal years run from October 1 to September 30 (FY2025 = October 2024 to September 2025). FY2026 results have not been published yet; the Division usually releases them in January.
Download the data FY2013-FY2025 (CSV) Includes the FLSA breakdown (minimum wage, overtime, retaliation, tips).
Fewer Investigations, Bigger Recoveries: RemoteLaws Recovery per Case
The number of cases the Wage and Hour Division concludes has fallen almost every year, while the money recovered in each case has risen. RemoteLaws divides back wages by concluded compliance actions to show this shift in a single, comparable figure.

Cite this chart (APA, MLA, HTML) and embed code
APA: RemoteLaws. (2026, November 21). Fewer cases, bigger recoveries: back wages per compliance action [Chart]. Data from Computed by RemoteLaws from U.S. DOL Wage and Hour Division data. https://remotelaws.com/statistics/wage-theft/
MLA: “Fewer cases, bigger recoveries: back wages per compliance action.” RemoteLaws, 21 Nov. 2026, https://remotelaws.com/statistics/wage-theft/. Chart; data from Computed by RemoteLaws from U.S. DOL Wage and Hour Division data.
HTML link with attribution:
Embed this chart:
In FY2013 the Division concluded 33,146 compliance actions; in FY2025, 16,924 (-48.9%, Computed by RemoteLaws). Over the same years, back wages per action rose from $7,541 to $15,321. Fewer, larger cases can mean a focus on bigger employers and systemic violations, but also that fewer small cases are being investigated at all.
What Kind of Wage Theft? Overtime, Minimum Wage, Tips and Retaliation
| Fiscal year | Total FLSA back wages | Overtime | Minimum wage | Tips | Retaliation | Workers owed (total) |
|---|---|---|---|---|---|---|
| FY2025 | $184,425,856 | $146,377,245 | $27,530,083 | $10,038,287 | $480,241 | 145,798 |
| FY2024 | $149,957,029 | $126,967,097 | $15,306,067 | $7,410,410 | $274,956 | 125,301 |
| FY2023 | $156,152,548 | $130,686,461 | $20,866,247 | $4,429,962 | $169,878 | 135,067 |
| FY2022 | $156,052,923 | $134,591,521 | $17,941,190 | $3,320,814 | $199,399 | 126,934 |
| FY2021 | $166,762,890 | $138,674,500 | $25,932,824 | $2,043,416 | $112,149 | 158,735 |
| FY2020 | $183,582,973 | $151,347,794 | $30,875,678 | $1,047,027 | $312,474 | 194,006 |
| FY2019 | $226,068,160 | $186,258,969 | $39,509,834 | $189,332 | $110,025 | 268,310 |
| FY2018 | $226,998,396 | $194,203,854 | $32,377,444 | $0 | $417,097 | 223,475 |
| FY2017 | $189,028,609 | $157,592,682 | $31,213,737 | $0 | $222,190 | 206,571 |
| FY2016 | $207,019,504 | $171,917,225 | $34,964,350 | $0 | $137,930 | 240,136 |
Overtime violations made up 79.4% of FLSA back wages in FY2025 and minimum wage violations 14.9% (Computed by RemoteLaws). Back wages for retaliation, such as firing a worker who complained, reached $480,241 for 327 workers, the most in the FY2016-FY2025 series. Tip-related back wages were zero before FY2019, when the Division began reporting them separately.
Source: U.S. DOL Wage and Hour Division, Fair Labor Standards Act data. Categories can overlap: a worker owed both minimum wage and overtime is counted in both, so the parts do not add up to the total.
Wage Theft by Industry: The RemoteLaws Wage Theft Severity Index (FY2025)
The Wage and Hour Division publishes results for 20 low-wage, high-violation industries, which together accounted for $195.6 million of the $259.3 million recovered in FY2025 (Computed by RemoteLaws). The Wage Theft Severity Index compares how much each affected worker was owed: an industry at 200 means its workers were owed, on average, twice the all-case average of $1,465.
Cite this chart (APA, MLA, HTML) and embed code
APA: RemoteLaws. (2026, November 21). RemoteLaws Wage Theft Severity Index by industry, FY2025 [Chart]. Data from Computed by RemoteLaws from U.S. DOL Wage and Hour Division data (FY2025). https://remotelaws.com/statistics/wage-theft/
MLA: “RemoteLaws Wage Theft Severity Index by industry, FY2025.” RemoteLaws, 21 Nov. 2026, https://remotelaws.com/statistics/wage-theft/. Chart; data from Computed by RemoteLaws from U.S. DOL Wage and Hour Division data (FY2025).
HTML link with attribution:
Embed this chart:
| Rank | Industry | Severity Index | Back wages per worker | Back wages | Workers owed | Cases | Penalties per $1 of back wages |
|---|---|---|---|---|---|---|---|
| 1 | Utilities | 273 | $4,004 | $1,653,478 | 413 | 36 | $0.00 |
| 2 | Temporary help | 263 | $3,850 | $8,492,228 | 2,206 | 129 | $0.13 |
| 3 | Apparel manufacturing | 193 | $2,830 | $681,951 | 241 | 53 | $0.00 |
| 4 | Animal processing | 163 | $2,388 | $4,378,093 | 1,833 | 69 | $0.49 |
| 5 | Construction | 162 | $2,368 | $43,420,356 | 18,340 | 1,802 | $0.11 |
| 6 | Warehousing | 159 | $2,330 | $468,362 | 201 | 74 | $0.12 |
| 7 | Janitorial services | 144 | $2,113 | $4,715,195 | 2,231 | 299 | $0.32 |
| 8 | Auto repair | 143 | $2,092 | $1,250,979 | 598 | 211 | $0.22 |
| 9 | Hair, nail and skin care | 140 | $2,054 | $328,620 | 160 | 59 | $0.19 |
| 10 | Landscaping services | 133 | $1,953 | $3,115,696 | 1,595 | 207 | $0.15 |
| 11 | Guard services | 119 | $1,744 | $10,965,507 | 6,287 | 491 | $0.05 |
| 12 | Retail | 113 | $1,662 | $8,646,369 | 5,203 | 1,058 | $0.42 |
| 13 | Health care | 111 | $1,621 | $53,291,920 | 32,884 | 2,370 | $0.09 |
| 14 | Trucking | 101 | $1,479 | $2,213,013 | 1,496 | 604 | $0.05 |
| 15 | Food services | 97 | $1,421 | $42,663,929 | 30,029 | 4,088 | $0.54 |
| 16 | Agriculture | 54 | $794 | $6,830,766 | 8,602 | 649 | $1.22 |
| 17 | Hotels and motels | 48 | $704 | $1,188,123 | 1,687 | 427 | $0.37 |
| 18 | Logistics | 48 | $696 | $410,238 | 589 | 15 | $0.00 |
| 19 | Amusement | 35 | $520 | $245,755 | 473 | 139 | $8.91 |
| 20 | Child care services | 22 | $322 | $606,091 | 1,883 | 367 | $0.05 |
Source: U.S. DOL WHD, low-wage, high-violation industries. Index, per-worker amounts and penalty ratios Computed by RemoteLaws.


Cite this chart (APA, MLA, HTML) and embed code
APA: RemoteLaws. (2026, November 21). Back wages recovered by industry, FY2025 [Chart]. Data from U.S. Department of Labor, Wage and Hour Division. https://remotelaws.com/statistics/wage-theft/
MLA: “Back wages recovered by industry, FY2025.” RemoteLaws, 21 Nov. 2026, https://remotelaws.com/statistics/wage-theft/. Chart; data from U.S. Department of Labor, Wage and Hour Division.
HTML link with attribution:
Embed this chart:
Wage Theft by State: The RemoteLaws Federal Wage Recovery Index (FY2024-FY2025)
The U.S. Department of Labor does not publish back-wage totals by state. RemoteLaws computed them from the Department’s case-by-case file (the WHISARD compliance action data in the DOL Enforcement Database), then divided each state’s back wages by its number of hourly paid workers (BLS, 2024). The Federal Wage Recovery Index shows how much federal investigators recovered for every 1,000 hourly workers over two fiscal years, FY2024 and FY2025 combined, so small and large states can be compared.


Cite this chart (APA, MLA, HTML) and embed code
APA: RemoteLaws. (2026, November 21). RemoteLaws Federal Wage Recovery Index by state, FY2024-FY2025 [Chart]. Data from Computed by RemoteLaws from U.S. DOL WHD case data (WHISARD) and BLS. https://remotelaws.com/statistics/wage-theft/
MLA: “RemoteLaws Federal Wage Recovery Index by state, FY2024-FY2025.” RemoteLaws, 21 Nov. 2026, https://remotelaws.com/statistics/wage-theft/. Chart; data from Computed by RemoteLaws from U.S. DOL WHD case data (WHISARD) and BLS.
HTML link with attribution:
Embed this chart:
| Rank | State | Back wages per 1,000 hourly workers | Index (50 states + DC = 100) | Back wages, 2 years | Workers owed | Cases | Workers owed per 10,000 hourly workers |
|---|---|---|---|---|---|---|---|
| 1 | District of Columbia | $37,915 | 1044 | $3,374,415 | 505 | 29 | 56.7 |
| 2 | Hawaii | $12,454 | 343 | $4,284,067 | 3,511 | 105 | 102.1 |
| 3 | Virginia | $7,595 | 209 | $14,172,133 | 5,997 | 373 | 32.1 |
| 4 | Maryland | $7,108 | 196 | $9,866,074 | 3,023 | 206 | 21.8 |
| 5 | New Mexico | $6,628 | 183 | $3,347,076 | 2,170 | 189 | 43.0 |
| 6 | Vermont | $6,628 | 183 | $1,126,730 | 1,076 | 47 | 63.3 |
| 7 | New Hampshire | $6,573 | 181 | $2,379,319 | 1,739 | 118 | 48.0 |
| 8 | Kentucky | $6,175 | 170 | $7,057,549 | 4,188 | 160 | 36.6 |
| 9 | New Jersey | $5,850 | 161 | $11,260,762 | 7,535 | 585 | 39.1 |
| 10 | Louisiana | $5,788 | 159 | $6,198,639 | 5,525 | 233 | 51.6 |
| 11 | Nevada | $5,748 | 158 | $5,087,202 | 1,994 | 131 | 22.5 |
| 12 | Maine | $5,628 | 155 | $2,110,617 | 1,160 | 74 | 30.9 |
| 13 | Pennsylvania | $5,457 | 150 | $17,254,848 | 13,947 | 726 | 44.1 |
| 14 | Texas | $4,822 | 133 | $34,581,689 | 27,036 | 2,875 | 37.7 |
| 15 | Alaska | $4,817 | 133 | $982,606 | 372 | 32 | 18.2 |
| 16 | New York | $4,646 | 128 | $18,831,683 | 9,813 | 774 | 24.2 |
| 17 | Arizona | $4,210 | 116 | $7,713,437 | 3,487 | 187 | 19.0 |
| 18 | Connecticut | $3,799 | 105 | $3,316,594 | 2,276 | 212 | 26.1 |
| 19 | North Carolina | $3,626 | 100 | $9,264,268 | 6,245 | 465 | 24.4 |
| 20 | Alabama | $3,559 | 98 | $4,128,122 | 3,577 | 231 | 30.8 |
| 21 | Delaware | $3,487 | 96 | $896,072 | 747 | 32 | 29.1 |
| 22 | Massachusetts | $3,385 | 93 | $5,574,699 | 2,267 | 221 | 13.8 |
| 23 | Wisconsin | $3,232 | 89 | $5,626,227 | 4,486 | 302 | 25.8 |
| 24 | Utah | $3,191 | 88 | $2,855,528 | 1,393 | 196 | 15.6 |
| 25 | California | $3,188 | 88 | $30,589,555 | 11,575 | 1,168 | 12.1 |
| 26 | Georgia | $3,178 | 88 | $7,439,599 | 3,310 | 295 | 14.1 |
| 27 | Indiana | $3,117 | 86 | $5,857,395 | 4,987 | 319 | 26.5 |
| 28 | Arkansas | $2,870 | 79 | $2,187,173 | 1,992 | 212 | 26.1 |
| 29 | Missouri | $2,718 | 75 | $4,427,445 | 4,120 | 293 | 25.3 |
| 30 | Illinois | $2,711 | 75 | $8,187,478 | 6,699 | 686 | 22.2 |
| 31 | Oklahoma | $2,672 | 74 | $2,664,462 | 2,650 | 220 | 26.6 |
| 32 | Florida | $2,582 | 71 | $12,273,689 | 11,667 | 1,016 | 24.5 |
| 33 | Rhode Island | $2,536 | 70 | $692,298 | 651 | 74 | 23.8 |
| 34 | Mississippi | $2,525 | 70 | $1,789,904 | 2,074 | 269 | 29.3 |
| 35 | Tennessee | $2,416 | 67 | $3,743,009 | 3,143 | 261 | 20.3 |
| 36 | Idaho | $2,373 | 65 | $1,286,374 | 1,139 | 56 | 21.0 |
| 37 | Minnesota | $2,363 | 65 | $3,957,764 | 2,171 | 139 | 13.0 |
| 38 | Michigan | $2,278 | 63 | $6,013,559 | 6,452 | 613 | 24.4 |
| 39 | South Carolina | $2,263 | 62 | $2,915,118 | 3,070 | 288 | 23.8 |
| 40 | Kansas | $2,205 | 61 | $1,746,085 | 1,970 | 138 | 24.9 |
| 41 | Ohio | $1,865 | 51 | $5,659,408 | 4,711 | 429 | 15.5 |
| 42 | Iowa | $1,695 | 47 | $1,454,123 | 1,407 | 211 | 16.4 |
| 43 | West Virginia | $1,635 | 45 | $706,302 | 1,381 | 219 | 32.0 |
| 44 | Nebraska | $1,609 | 44 | $933,506 | 518 | 73 | 8.9 |
| 45 | Washington | $1,543 | 42 | $3,022,377 | 784 | 115 | 4.0 |
| 46 | Colorado | $1,517 | 42 | $1,978,764 | 1,320 | 189 | 10.1 |
| 47 | Oregon | $677 | 19 | $737,655 | 516 | 48 | 4.7 |
| 48 | South Dakota | $626 | 17 | $170,966 | 282 | 49 | 10.3 |
| 49 | Wyoming | $111 | 3 | $18,506 | 24 | 16 | 1.4 |
| 50 | North Dakota | $69 | 2 | $15,722 | 13 | 40 | 0.6 |
| 51 | Montana | $48 | 1 | $14,662 | 19 | 23 | 0.6 |
Sources: U.S. DOL WHD compliance action data (WHISARD), cases grouped by state and by findings end date; hourly paid workers from BLS, 2024, Table 3. All ratios Computed by RemoteLaws. State links go to each state’s employment law guide.
The seven states that, according to a survey by the Economic Policy Institute (a private research group), do not recover wages through a state agency rank between 10th and 39th (EPI, 2026). Where wages are owed also depends on state minimum wage and overtime rules: see the minimum wage by state, the US minimum wage statistics and the employment law guide for each state.
Download state data FY2024-FY2025 (CSV)
How Much Wage Theft Goes Unrecovered? (Separate Estimate)
Recovered back wages measure what enforcement finds, not how much wage theft happens. The Economic Policy Institute estimates that low-wage workers lost $52.5 billion to all forms of wage theft in 2025, applying violation rates from a 2008 survey of low-wage workers in Chicago, Los Angeles and New York to today’s workforce. It also counts about $961 million recovered in 2025 through the U.S. Department of Labor, state agencies and the largest class action settlements combined (EPI, 2026).
If You Think You Are a Victim of Wage Theft
- Check whether money is already waiting for you: the Department of Labor holds back wages it could not deliver. Search the Workers Owed Wages database by employer name.
- Keep your own records: hours worked, pay stubs, schedules and tips. The DOL offers a free timesheet app for iOS and Android.
- File a complaint: call the Wage and Hour Division at 1-866-487-9243 (1-866-4US-WAGE). Complaints are confidential and retaliation for filing is illegal.
- Know your state rules: many states have higher minimum wages, daily overtime or final paycheck deadlines. See Can my employer cut my pay? and the final paycheck calculator.
Methodology: What These Wage Theft Numbers Measure
- Back wages are the amounts the Wage and Hour Division found employers owed workers in concluded compliance actions (investigations, conciliations and other actions) under all the laws it enforces: the Fair Labor Standards Act, the Davis-Bacon and Service Contract Acts, the H-2A and H-2B programs, and others. They are found due, not always fully paid.
- Fiscal years: FY2025 covers October 1, 2024 to September 30, 2025. Results are counted when a case is concluded, so a single year can include violations that occurred years earlier.
- Workers counted: employees receiving back wages in concluded cases. A worker involved in two cases can be counted twice.
- Industry data cover the 20 low-wage, high-violation industries the Division tracks, not every industry.
- RemoteLaws indices: Recovery per Case = back wages ÷ concluded compliance actions; Wage Theft Severity Index = (industry back wages ÷ industry workers owed) ÷ (all back wages ÷ all workers owed) × 100; penalty ratio = civil money penalties ÷ back wages; Federal Wage Recovery Index = state back wages (FY2024 + FY2025, by findings end date) ÷ hourly paid workers in the state (BLS 2024), per 1,000 workers. All are Computed by RemoteLaws from the official tables, with no estimation.
- Not measured: wage theft that is never reported or investigated, state agency recoveries and private lawsuits. Official figures are therefore a floor.
How to Cite This Page and Reuse the Data
Free to use under CC BY 4.0. Journalists, researchers, bloggers and AI tools may quote any figure, ranking, index or chart on this page, including the indices computed by RemoteLaws, as long as they credit RemoteLaws with a link to this page. The underlying official data stay credited to their agencies.
Need a state breakdown, a custom chart or an expert comment? Contact the RemoteLaws Research Team.
APA: RemoteLaws Research Team. (2026, November 21). Wage Theft Statistics 2026-2027 and the RemoteLaws Wage Theft Severity Index. RemoteLaws. https://remotelaws.com/statistics/wage-theft/
MLA: RemoteLaws Research Team. “Wage Theft Statistics 2026-2027 and the RemoteLaws Wage Theft Severity Index.” RemoteLaws, 21 Nov. 2026, https://remotelaws.com/statistics/wage-theft/.
HTML link with attribution:
Frequently Asked Questions
How much wage theft is recovered each year in the US?
The U.S. Department of Labor recovered $259,294,764 in back wages for 176,957 workers in fiscal year 2025, an average of $1,465 per worker (Wage and Hour Division). State agencies and private lawsuits recover more on top of that.
Is wage theft increasing?
Recovered back wages rose 27.9% in FY2025 to the highest level since FY2019, while the number of concluded cases fell to 16,924, the lowest in the FY2013-FY2025 series (Computed by RemoteLaws from DOL data). Recoveries measure enforcement, not the total amount of wage theft.
What is the most common type of wage theft?
Unpaid overtime. It accounted for 79% of Fair Labor Standards Act back wages in FY2025 ($146,377,245 for 110,551 workers), Computed by RemoteLaws from DOL data.
Which industry has the most wage theft?
By back wages recovered in FY2025, health care ($53.3 million), construction ($43.4 million) and food services ($42.7 million). By money owed per worker, utilities ranked first on the RemoteLaws Wage Theft Severity Index.
What is the RemoteLaws Wage Theft Severity Index?
The average back wages owed per affected worker in an industry, divided by the average for all cases ($1,465 in FY2025) and multiplied by 100. It is computed by RemoteLaws from official U.S. Department of Labor data and can be cited with a link to this page.
How much does the average worker get back in a wage theft case?
About $1,465 per worker in fiscal year 2025 across all laws enforced by the Wage and Hour Division.
How do I report wage theft?
Contact the U.S. Department of Labor Wage and Hour Division at 1-866-487-9243 or your state labor department. You can also search the Workers Owed Wages database to see if the Department is holding back wages for you.
Which states have the most wage theft?
The U.S. Department of Labor does not publish state totals. Computed by RemoteLaws from its case file, federal investigators recovered the most back wages per 1,000 hourly workers in FY2024-FY2025 in the District of Columbia ($37,915), Hawaii and Virginia, against $3,631 nationally. This measures federal recoveries, not how much wage theft occurs: states with strong state agencies rank lower.
Sources, Methodology Notes & Update Log
- Totals by year: U.S. DOL Wage and Hour Division, All Acts data, read November 21, 2026. FY2025 summary: WHD data page and the DOL news release of January 8, 2026.
- Violation types: WHD Fair Labor Standards Act data. Industries: WHD low-wage, high-violation industries, read November 21, 2026.
- Separate estimate and state survey: Economic Policy Institute, 2026 (private research organization; figures labeled as EPI).
- Computed by RemoteLaws: the Federal Wage Recovery Index and state ratios, Recovery per Case, the Wage Theft Severity Index, penalty ratios, workers per minute, recoveries per day, overtime and minimum wage shares and year-over-year changes. No figure on this page is estimated by RemoteLaws.
- State data: DOL Enforcement Database, Wage and Hour compliance action data (WHISARD), extracted November 21, 2026 and summed by state for cases whose findings ended in FY2024 or FY2025 (50 states and DC: $291,773,256 over two years). The file covers 82% (FY2024) and 53% (FY2025) of the official national back wages because it has no case-closing date and excludes open cases.
- Update log: November 21, 2026, page created; same day, the 50-state Federal Wage Recovery Index added.