
US Labor Market Statistics — Original RemoteLaws analysis of official data — Updated November 22, 2026
US Job Openings 2026-2027: JOLTS Data, Monthly Trend and Every State Ranked
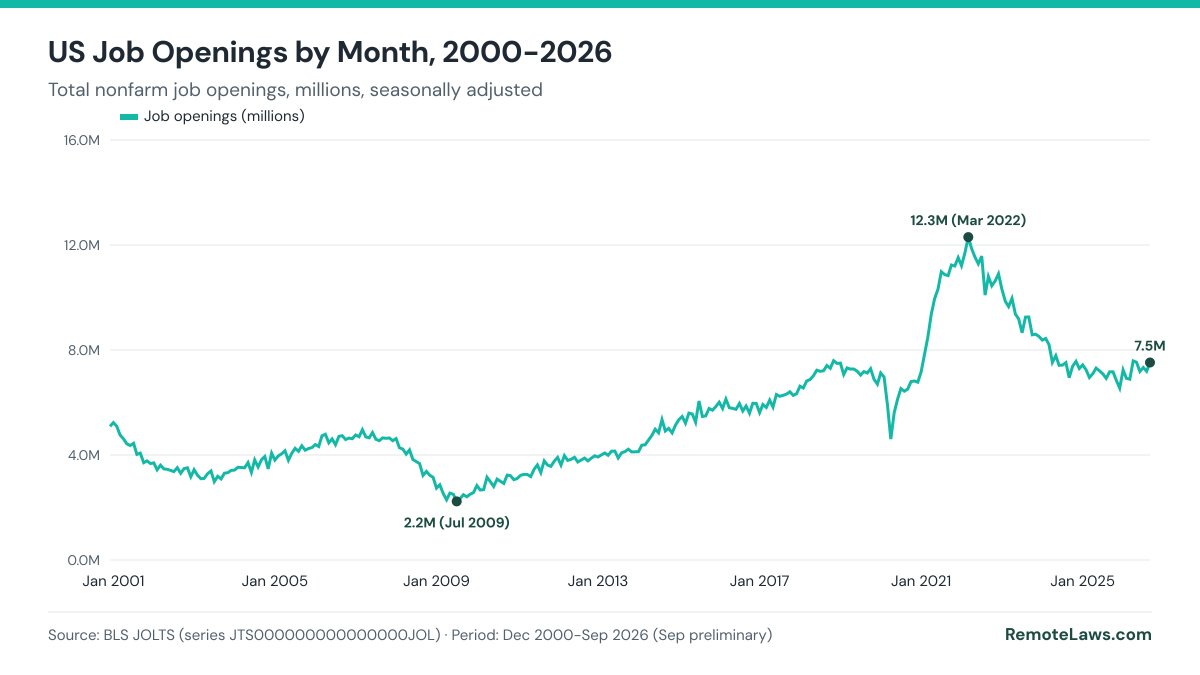
US employers had 7.5 million job openings at the end of September 2026, a job openings rate of 4.5%, according to the preliminary BLS JOLTS estimate released November 3, 2026. That is 333,000 more than in August and 354,000 more than a year earlier, but still 39% below the March 2022 record of 12.3 million. With 7.1 million unemployed people, there were 1.06 openings per job seeker, computed by RemoteLaws (BLS JOLTS, November 3, 2026 release; BLS CPS).

By the RemoteLaws Research Team · Published November 22, 2026 · Latest data: September 2026 (preliminary) · Next update: December 1, 2026 (October data)
Key Job Openings Statistics (Latest BLS Data)
- 7.523 million job openings in September 2026 (preliminary, seasonally adjusted), rate 4.5%. Source: BLS JOLTS, November 3, 2026 release, Table 1.
- +333,000 from August 2026 (7.190 million) and +354,000 (+4.9%) from September 2025 (7.169 million). Source: BLS JOLTS Table 1; percentage computed by RemoteLaws.
- Record high: 12.301 million openings and a 7.5% rate in March 2022. Record low: 2.232 million in July 2009. Source: BLS series JTS000000000000000JOL, December 2000 to September 2026.
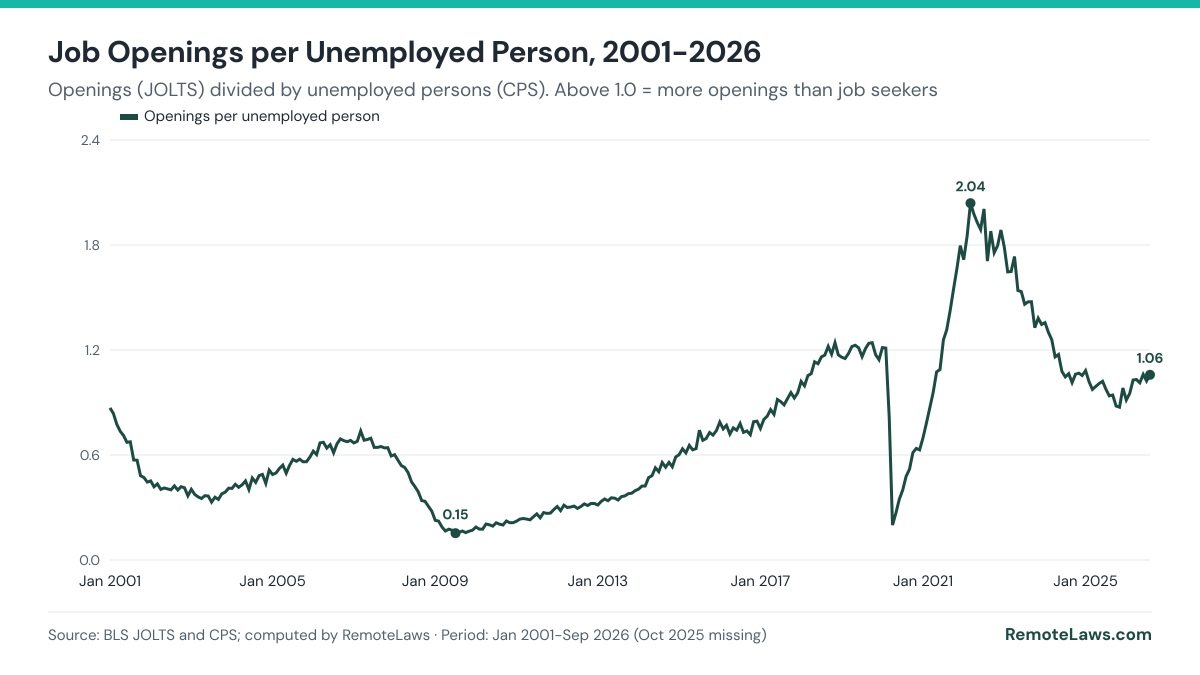
- 1.06 openings per unemployed person in September 2026 (7.523 million openings, 7.109 million unemployed), down from 2.04 in March 2022 and 1.24 in September 2019. Computed by RemoteLaws from BLS JOLTS and CPS.
- The September 2026 rate of 4.5% is above the 2001-2019 average of 3.1%. Computed by RemoteLaws from monthly BLS rates.
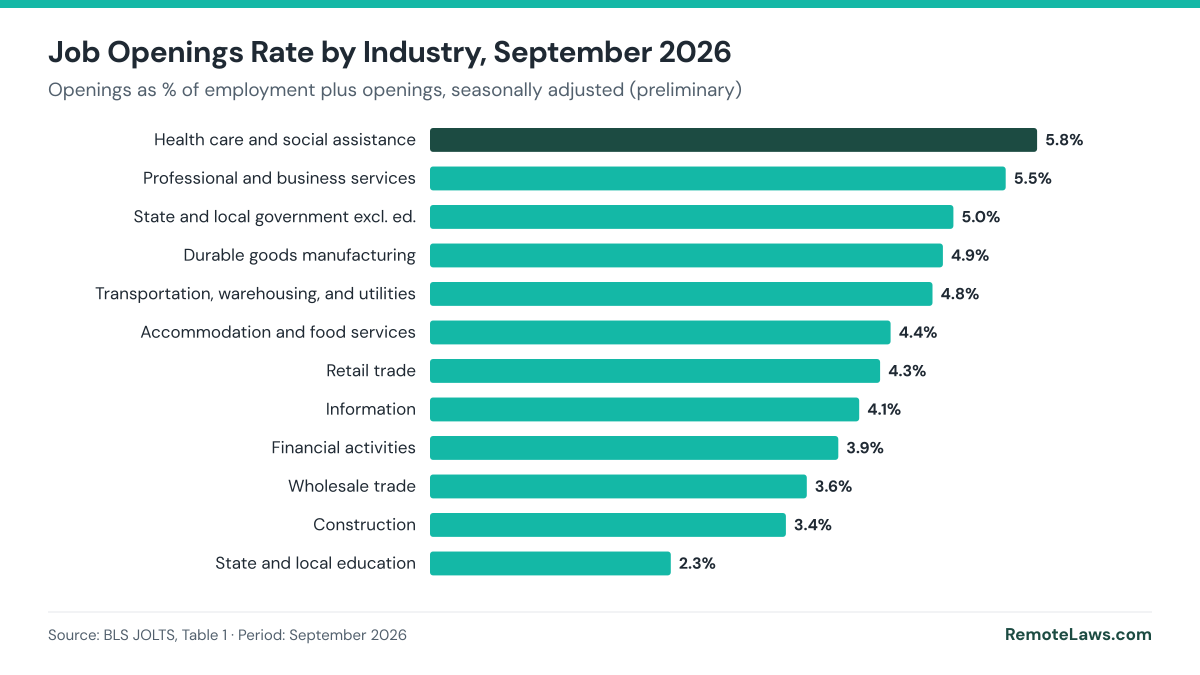
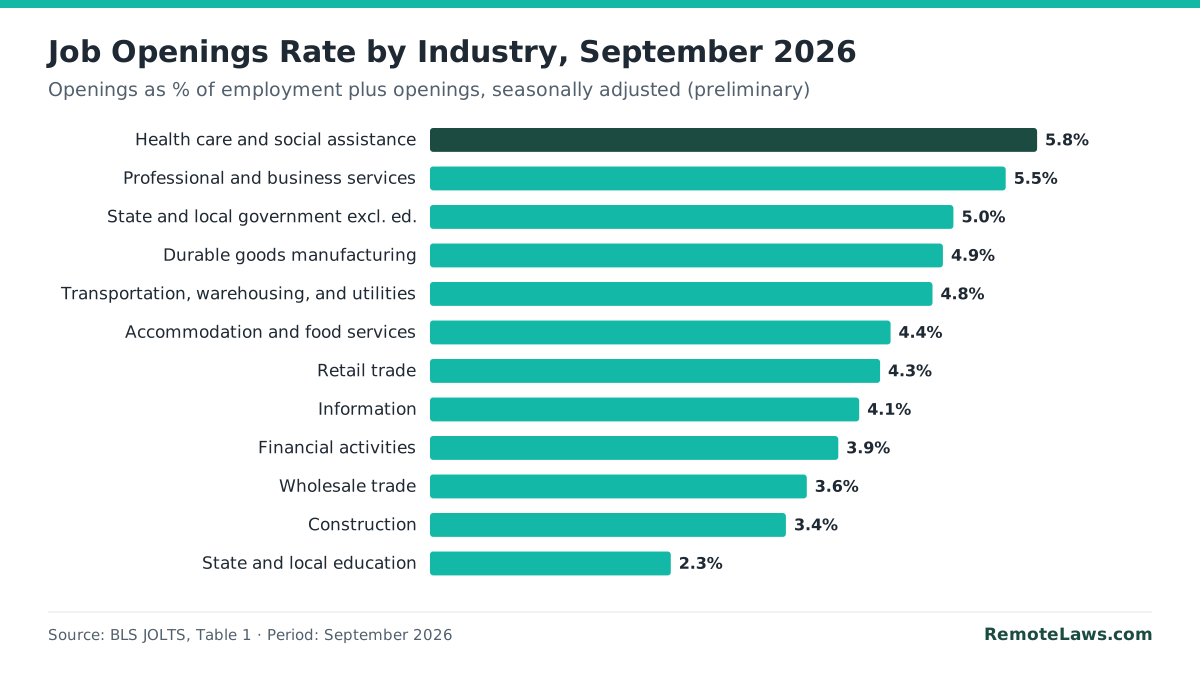
- Health care and social assistance had the most openings (1.479 million) and the highest rate of any industry in Table 1 (5.8%) in September 2026. Source: BLS JOLTS Table 1.
- By region, the West had the highest rate (4.8%) and the Northeast the lowest (4.3%) in September 2026. Source: BLS JOLTS Table 1.
- August 2026 was revised up by 111,000 to 7.190 million. Source: BLS JOLTS, November 3, 2026.
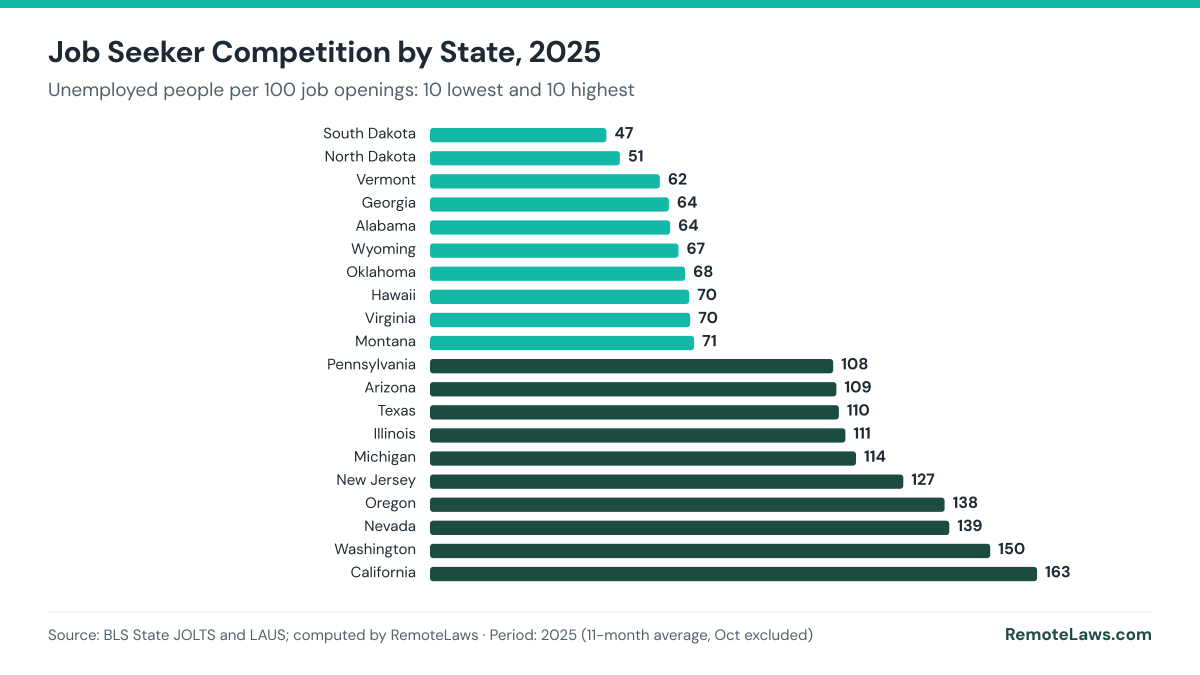
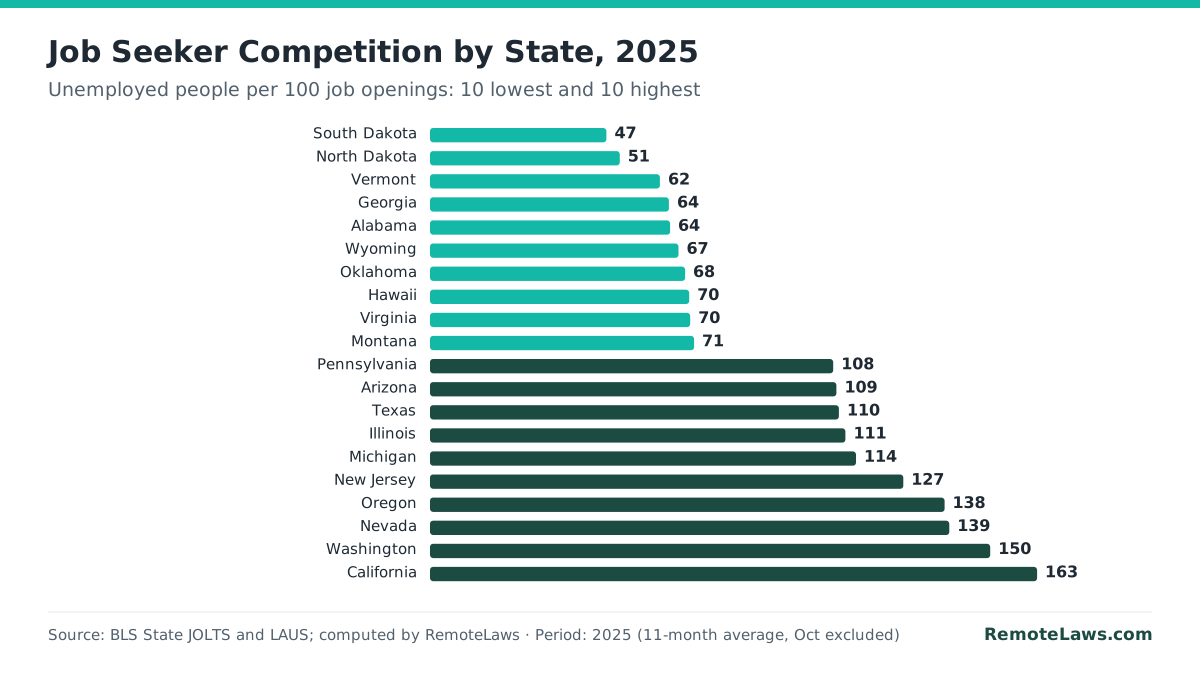
- In 2025, South Dakota had the fewest unemployed people per 100 openings (47) and California the most (163); the US figure was 103. Computed by RemoteLaws from BLS State JOLTS and LAUS.
Monthly Job Openings: The Trend Since 2000
Cite this chart (APA, MLA, HTML) and embed code
APA: RemoteLaws. (2026, November 22). US Job Openings by Month, December 2000 to September 2026 [Chart]. Data from BLS JOLTS. https://remotelaws.com/statistics/job-openings/
MLA: “US Job Openings by Month, December 2000 to September 2026.” RemoteLaws, 22 Nov. 2026, https://remotelaws.com/statistics/job-openings/. Chart; data from BLS JOLTS.
HTML link with attribution:
Embed this chart:
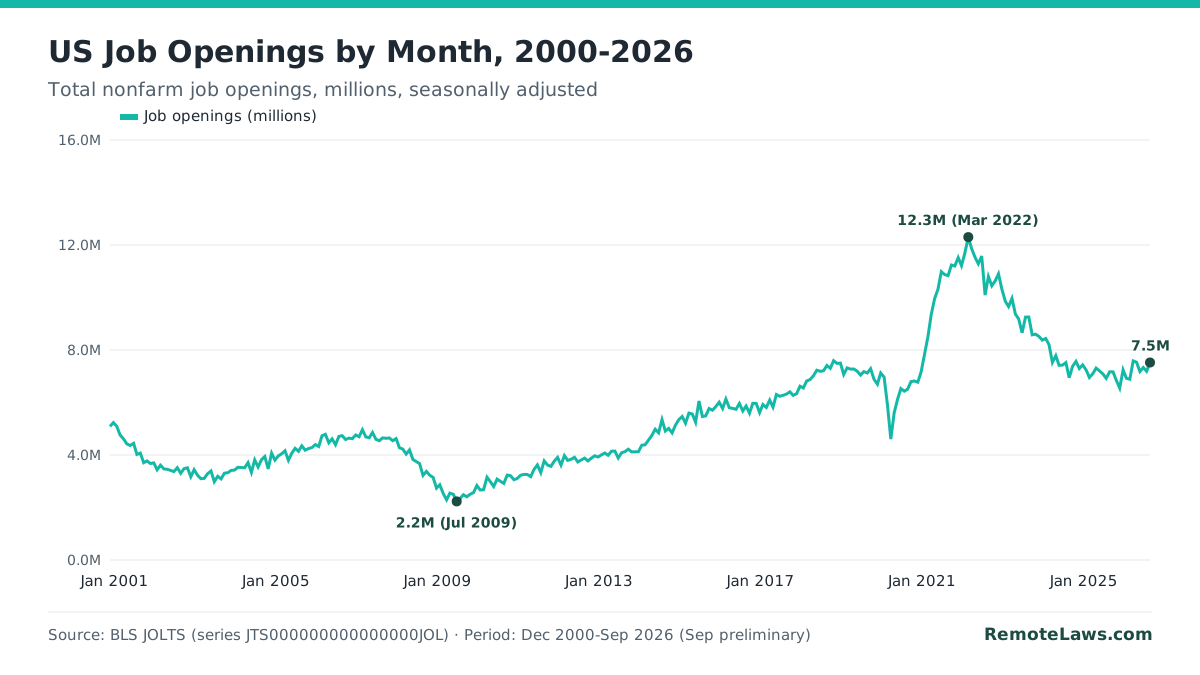
JOLTS has measured job openings every month since December 2000. Openings climbed from the 2009 recession low of 2.2 million to about 7 million in 2018-2019, dropped in spring 2020, then surged to a record 12.3 million in March 2022. Since then they have fallen back to roughly the 2019 level: the 2025 average was 7.08 million, compared with 7.15 million in 2019 (annual averages computed by RemoteLaws).
| Month | Job openings | Rate | Unemployed (CPS) | Openings per unemployed* |
|---|---|---|---|---|
| Sep 2026 (p) | 7,523 | 4.5% | 7,109 | 1.06 |
| Aug 2026 | 7,190 | 4.3% | 7,031 | 1.02 |
| Jul 2026 | 7,335 | 4.4% | 6,916 | 1.06 |
| Jun 2026 | 7,182 | 4.3% | 7,094 | 1.01 |
| May 2026 | 7,537 | 4.5% | 7,307 | 1.03 |
| Apr 2026 | 7,585 | 4.6% | 7,373 | 1.03 |
| Mar 2026 | 6,887 | 4.2% | 7,239 | 0.95 |
| Feb 2026 | 6,922 | 4.2% | 7,571 | 0.91 |
| Jan 2026 | 7,240 | 4.4% | 7,368 | 0.98 |
| Dec 2025 | 6,550 | 4.0% | 7,503 | 0.87 |
| Nov 2025 | 6,846 | 4.1% | 7,781 | 0.88 |
| Oct 2025 | 7,170 | 4.3% | Not collected | — |
| Sep 2025 | 7,169 | 4.3% | 7,605 | 0.94 |
(p) Preliminary. *Computed by RemoteLaws. The CPS was not collected in October 2025 because of the lapse in appropriations, so no ratio exists for that month. Sources: BLS JOLTS, BLS CPS.
Job Openings per Unemployed Person (RemoteLaws Ratio)
Cite this chart (APA, MLA, HTML) and embed code
APA: RemoteLaws. (2026, November 22). Job Openings per Unemployed Person, 2001 to 2026 [Chart]. Data from BLS JOLTS and CPS, computed by RemoteLaws. https://remotelaws.com/statistics/job-openings/
MLA: “Job Openings per Unemployed Person, 2001 to 2026.” RemoteLaws, 22 Nov. 2026, https://remotelaws.com/statistics/job-openings/. Chart; data from BLS JOLTS and CPS, computed by RemoteLaws.
HTML link with attribution:
Embed this chart:
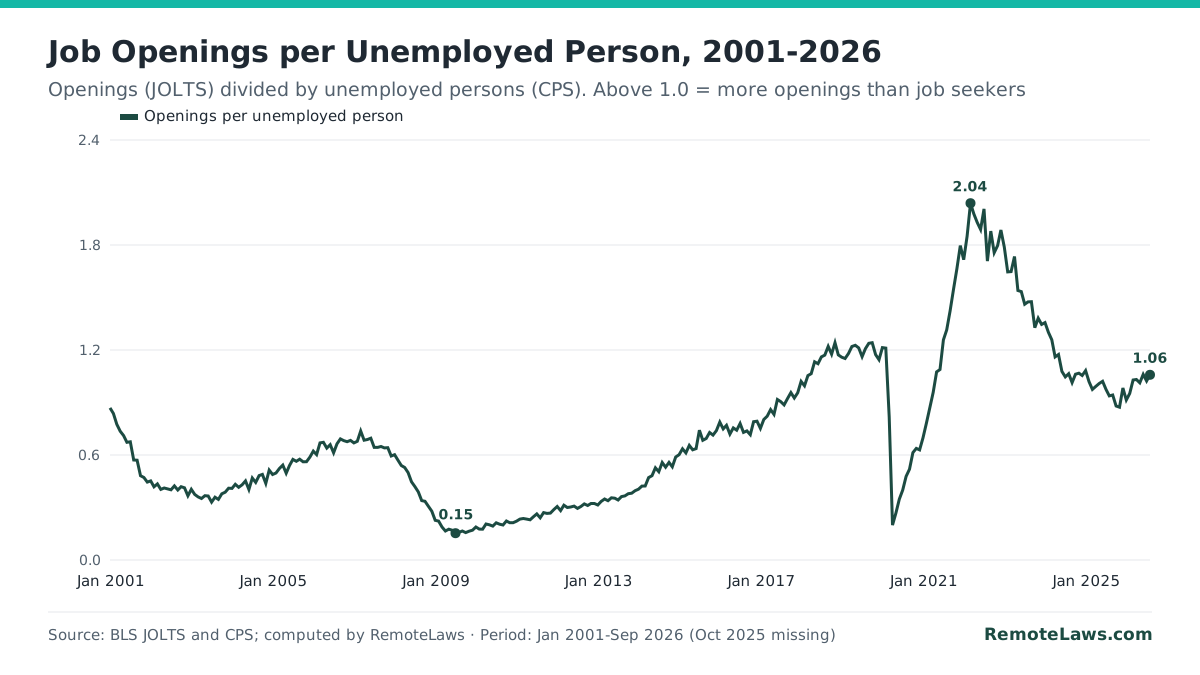
Dividing job openings by the number of unemployed people shows how hard it is to find work. Above 1.0 there are more openings than job seekers. The ratio was 0.15 in July 2009, crossed 1.0 in 2018, reached a record 2.04 in March 2022 and was 1.06 in September 2026, slightly above August (1.02). The ratio does not mean every unemployed person could fill an opening: skills, location and pay often do not match.
Job Openings by Industry and Region, September 2026
Cite this chart (APA, MLA, HTML) and embed code
APA: RemoteLaws. (2026, November 22). Job Openings Rate by Industry, September 2026 [Chart]. Data from BLS JOLTS Table 1. https://remotelaws.com/statistics/job-openings/
MLA: “Job Openings Rate by Industry, September 2026.” RemoteLaws, 22 Nov. 2026, https://remotelaws.com/statistics/job-openings/. Chart; data from BLS JOLTS Table 1.
HTML link with attribution:
Embed this chart:
| Industry | Openings (thousands) | Rate |
|---|---|---|
| Health care and social assistance | 1,479 | 5.8% |
| Professional and business services | 1,310 | 5.5% |
| Retail trade | 698 | 4.3% |
| Accommodation and food services | 659 | 4.4% |
| State and local government, excluding education | 519 | 5.0% |
| Durable goods manufacturing | 403 | 4.9% |
| Financial activities | 364 | 3.9% |
| Transportation, warehousing, and utilities | 360 | 4.8% |
| Construction | 298 | 3.4% |
| State and local education | 257 | 2.3% |
| Wholesale trade | 225 | 3.6% |
| Information | 116 | 4.1% |
| Region | Openings (thousands) | Rate | Change from August |
|---|---|---|---|
| West | 1,870 | 4.8% | +244,000 |
| Midwest | 1,625 | 4.6% | +90,000 |
| South | 2,747 | 4.4% | −49,000 |
| Northeast | 1,281 | 4.3% | +49,000 |
Source: BLS JOLTS, November 3, 2026 release, Table 1. Rates are openings as a percent of employment plus openings.
Job Openings by State: Where Job Seekers Face the Least Competition
The RemoteLaws Job Seeker Competition Index counts unemployed people for every 100 job openings in each state. A lower number means fewer people competing for each opening. It uses the latest BLS state estimates, which run through December 2025, and averages the months for which both series exist.
Cite this chart (APA, MLA, HTML) and embed code
APA: RemoteLaws. (2026, November 22). Unemployed People per 100 Job Openings by State, 2025 [Chart]. Data from BLS State JOLTS and LAUS, computed by RemoteLaws. https://remotelaws.com/statistics/job-openings/
MLA: “Unemployed People per 100 Job Openings by State, 2025.” RemoteLaws, 22 Nov. 2026, https://remotelaws.com/statistics/job-openings/. Chart; data from BLS State JOLTS and LAUS, computed by RemoteLaws.
HTML link with attribution:
Embed this chart:
| Rank | State | Unemployed per 100 openings* | Openings per unemployed* | Average openings | Openings rate 2025* | 2022* | 2019* |
|---|---|---|---|---|---|---|---|
| 1 | South Dakota | 47 | 2.11 | 21,417 | 4.4% | 6.5% | 4.8% |
| 2 | North Dakota | 51 | 1.96 | 21,917 | 4.7% | 6.7% | 5.6% |
| 3 | Vermont | 62 | 1.62 | 14,833 | 4.5% | 7.2% | 4.8% |
| 4 | Georgia | 64 | 1.56 | 288,333 | 5.5% | 8.0% | 4.8% |
| 5 | Alabama | 64 | 1.55 | 105,333 | 4.6% | 6.9% | 4.4% |
| 6 | Wyoming | 67 | 1.50 | 14,333 | 4.6% | 7.6% | 5.6% |
| 7 | Oklahoma | 68 | 1.46 | 98,083 | 5.2% | 7.0% | 4.6% |
| 8 | Hawaii | 70 | 1.44 | 23,417 | 3.5% | 6.0% | 4.5% |
| 9 | Virginia | 70 | 1.43 | 216,917 | 4.8% | 7.3% | 5.1% |
| 10 | Montana | 71 | 1.41 | 27,000 | 4.9% | 8.1% | 5.4% |
| 11 | Maine | 73 | 1.36 | 32,167 | 4.6% | 6.8% | 4.7% |
| 12 | Nebraska | 76 | 1.32 | 42,500 | 3.9% | 6.5% | 4.6% |
| 13 | New Hampshire | 76 | 1.32 | 32,583 | 4.5% | 7.3% | 4.4% |
| 14 | Wisconsin | 78 | 1.28 | 126,750 | 4.0% | 7.1% | 4.9% |
| 15 | Mississippi | 78 | 1.28 | 62,833 | 5.0% | 7.1% | 4.3% |
| 16 | District of Columbia | 79 | 1.27 | 32,833 | 4.2% | 5.6% | 3.8% |
| 17 | North Carolina | 79 | 1.26 | 253,250 | 4.8% | 7.3% | 5.8% |
| 18 | West Virginia | 80 | 1.24 | 40,500 | 5.3% | 8.2% | 5.3% |
| 19 | Tennessee | 82 | 1.23 | 152,583 | 4.3% | 7.5% | 4.3% |
| 20 | Minnesota | 84 | 1.19 | 142,667 | 4.5% | 7.0% | 4.5% |
| 21 | Louisiana | 87 | 1.15 | 102,917 | 4.9% | 7.4% | 4.4% |
| 22 | Utah | 88 | 1.13 | 73,167 | 4.0% | 6.7% | 4.9% |
| 23 | Alaska | 89 | 1.12 | 19,250 | 5.4% | 8.9% | 6.5% |
| 24 | Missouri | 90 | 1.11 | 138,583 | 4.4% | 6.7% | 4.8% |
| 25 | Arkansas | 91 | 1.10 | 64,167 | 4.6% | 7.0% | 4.6% |
| 26 | Kansas | 91 | 1.10 | 65,083 | 4.3% | 6.6% | 4.8% |
| 27 | New York | 91 | 1.10 | 473,333 | 4.5% | 5.5% | 3.8% |
| 28 | Idaho | 92 | 1.09 | 40,000 | 4.4% | 7.3% | 5.0% |
| 29 | Indiana | 93 | 1.07 | 139,417 | 4.1% | 6.4% | 4.7% |
| 30 | Iowa | 95 | 1.06 | 63,917 | 3.9% | 6.8% | 4.5% |
| 31 | New Mexico | 95 | 1.05 | 42,500 | 4.5% | 7.4% | 5.2% |
| 32 | South Carolina | 96 | 1.05 | 120,000 | 4.8% | 7.4% | 4.9% |
| 33 | Kentucky | 96 | 1.04 | 101,083 | 4.7% | 7.6% | 4.4% |
| 34 | Ohio | 99 | 1.01 | 276,500 | 4.7% | 6.8% | 4.7% |
| 35 | Florida | 101 | 0.99 | 427,000 | 4.1% | 6.7% | 4.5% |
| 36 | Maryland | 102 | 0.98 | 128,500 | 4.4% | 7.2% | 4.8% |
| 37 | Delaware | 104 | 0.96 | 23,583 | 4.5% | 7.3% | 4.6% |
| 38 | Colorado | 104 | 0.96 | 126,000 | 4.1% | 7.3% | 5.0% |
| 39 | Rhode Island | 107 | 0.93 | 24,333 | 4.5% | 7.1% | 4.6% |
| 40 | Massachusetts | 107 | 0.93 | 163,417 | 4.2% | 7.2% | 4.3% |
| 41 | Connecticut | 107 | 0.93 | 71,250 | 4.0% | 6.8% | 3.7% |
| 42 | Pennsylvania | 108 | 0.92 | 257,333 | 4.0% | 7.0% | 4.3% |
| 43 | Arizona | 109 | 0.92 | 150,083 | 4.4% | 7.1% | 5.1% |
| 44 | Texas | 110 | 0.91 | 605,083 | 4.1% | 6.9% | 4.3% |
| 45 | Illinois | 111 | 0.90 | 268,417 | 4.2% | 6.8% | 4.3% |
| 46 | Michigan | 114 | 0.88 | 226,167 | 4.8% | 6.9% | 4.7% |
| 47 | New Jersey | 127 | 0.79 | 203,583 | 4.4% | 5.9% | 4.2% |
| 48 | Oregon | 138 | 0.72 | 82,250 | 4.0% | 6.9% | 5.0% |
| 49 | Nevada | 139 | 0.72 | 62,833 | 3.8% | 6.6% | 4.5% |
| 50 | Washington | 150 | 0.67 | 125,083 | 3.3% | 6.2% | 4.5% |
| 51 | California | 163 | 0.61 | 667,417 | 3.6% | 6.6% | 4.2% |
*Computed by RemoteLaws. Index = average unemployed (BLS LAUS, seasonally adjusted) divided by average job openings (BLS State JOLTS, seasonally adjusted), times 100, over January to September and November to December 2025 (October 2025 LAUS data were not produced). Rates are averages of the 12 monthly rates of each year. Sources: BLS State JOLTS, BLS LAUS. Download the state CSV.
How the JOLTS Report Works
The Job Openings and Labor Turnover Survey (JOLTS) asks about 21,000 business and government establishments each month how many positions they had open on the last business day of the month, and how many people they hired and lost during the month. A position counts as an opening only if a specific job exists, work could start within 30 days, and the employer is actively recruiting from outside the establishment (BLS JOLTS).
- Release timing: about five weeks after the reference month. October 2026 data are scheduled for December 1, 2026.
- Revisions: each month the prior month is revised as late reports arrive; seasonal factors and benchmarks are updated with January data each year.
- Not the same as online job postings: job board counts (such as Indeed or LinkedIn) measure ads, not employer-reported openings, and often move differently.
- Not the jobs report: the monthly Employment Situation (CES and CPS) measures employment and unemployment; JOLTS measures demand and turnover.
Download the Data
Monthly US series, CSVState ranking 2025, CSV
Monthly file: openings, rate and unemployed (thousands), December 2000 to September 2026, plus the ratio computed by RemoteLaws. CC BY 4.0.
How to Cite This Page and Reuse the Data
Free to use under CC BY 4.0. Journalists, researchers, bloggers and AI tools may quote any figure, ranking, index or chart on this page, including the indices computed by RemoteLaws, as long as they credit RemoteLaws with a link to this page. The underlying official data stay credited to their agencies.
Need a state breakdown, a custom chart or an expert comment? Contact the RemoteLaws Research Team.
APA: RemoteLaws Research Team. (2026, November 22). US Job Openings 2026-2027: JOLTS Data, Monthly Trend and Every State Ranked. RemoteLaws. https://remotelaws.com/statistics/job-openings/
MLA: RemoteLaws Research Team. “US Job Openings 2026-2027: JOLTS Data, Monthly Trend and Every State Ranked.” RemoteLaws, 22 Nov. 2026, https://remotelaws.com/statistics/job-openings/.
HTML link with attribution:
Frequently Asked Questions
How many job openings are there in the US right now?
7.523 million at the end of September 2026, a 4.5% rate, according to the preliminary BLS JOLTS estimate released November 3, 2026. The next figure, for October 2026, is due December 1, 2026.
What is the JOLTS report?
The Job Openings and Labor Turnover Survey, published monthly by the Bureau of Labor Statistics. It reports job openings, hires, quits, layoffs and other separations for the US, by industry, region and establishment size.
What is the job openings rate?
Job openings divided by employment plus job openings, times 100. In September 2026 it was 4.5%, compared with a record 7.5% in March 2022 and a 2001-2019 average of 3.1% (average computed by RemoteLaws).
What was the highest number of job openings ever recorded?
12.301 million in March 2022, the highest since the series began in December 2000.
How many job openings are there per unemployed person?
1.06 in September 2026: 7.523 million openings and 7.109 million unemployed people, computed by RemoteLaws. The ratio peaked at 2.04 in March 2022.
Which industry has the most job openings?
Health care and social assistance, with 1.479 million openings and a 5.8% rate in September 2026.
Which state has the most job openings?
California had the most openings in 2025 (about 667,000 a month on average), but also the most unemployed people per opening. South Dakota had the least competition: 47 unemployed people per 100 openings, computed by RemoteLaws.
Why are JOLTS numbers revised?
Late survey responses arrive after the first estimate, and seasonal factors are recalculated. August 2026 was revised up by 111,000 to 7.190 million.
When is the next JOLTS report?
December 1, 2026 at 10:00 a.m. Eastern, with October 2026 data.
Is JOLTS the same as job postings on job boards?
No. JOLTS counts positions employers report as open and actively recruited; job board indexes count advertisements and can differ in level and timing.
Sources, Methodology Notes & Update Log
- National figures for September 2026 and the August revision: BLS JOLTS, November 3, 2026 release (USDL-26-1630), Tables 1 and A, read November 22, 2026.
- Monthly series December 2000 to September 2026: JTS000000000000000JOL and JTS000000000000000JOR; unemployed persons: LNS13000000, read November 22, 2026.
- State estimates: BLS State JOLTS (latest month available: December 2025) and BLS LAUS seasonally adjusted unemployment (October 2025 not produced). Check: the sum of the 51 state 2025 averages (7.083 million) matches the national 2025 average (7.082 million).
- Computed by RemoteLaws: year-over-year change, openings per unemployed person, the 2001-2019 average rate, annual averages and the Job Seeker Competition Index.
- Release schedule: BLS JOLTS schedule.
- Update log: November 22, 2026, page created with September 2026 data.