
US Labor Market Statistics — Original RemoteLaws analysis of official data — Updated November 22, 2026
US Quits Rate 2026-2027: Monthly JOLTS Data, the Great Resignation and Every State Ranked
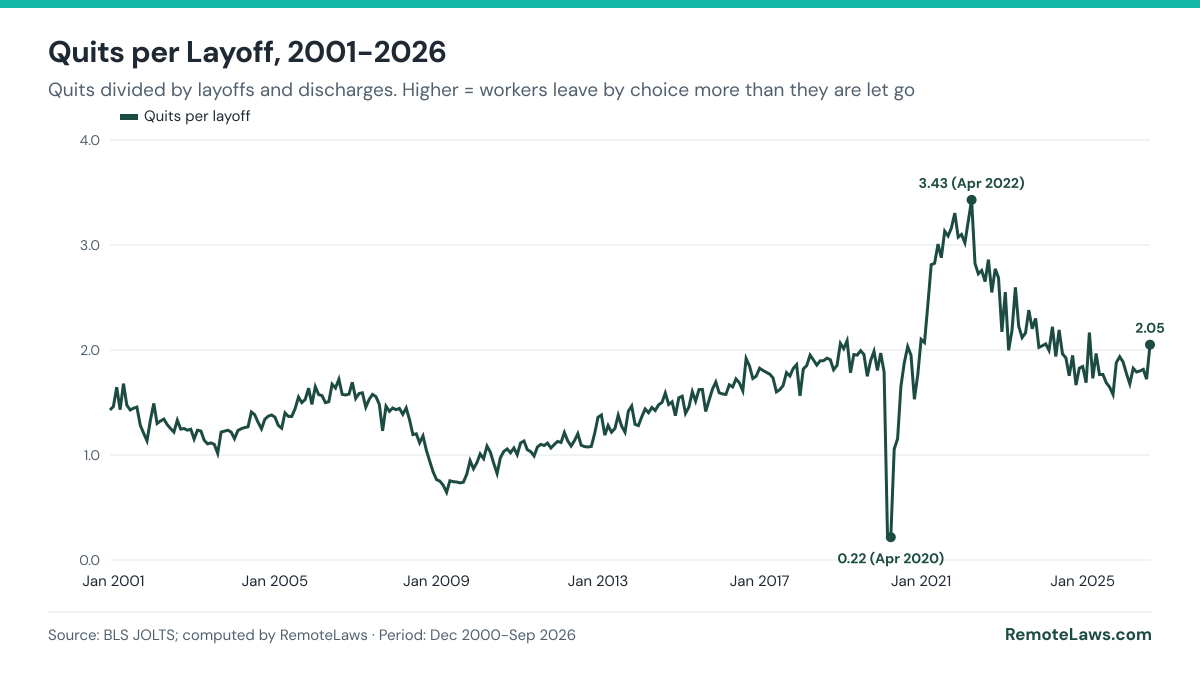
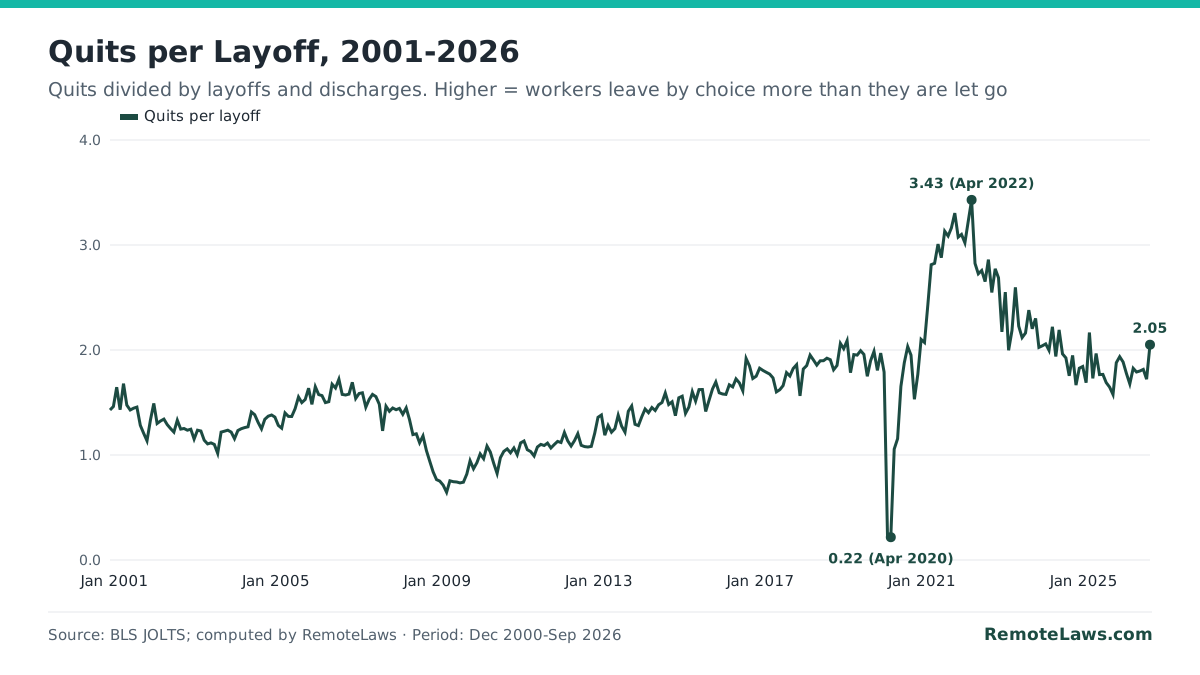
3.365 million US workers quit their jobs in September 2026, a quits rate of 2.1%, according to the preliminary BLS JOLTS estimate released November 3, 2026. Quits rose by 321,000 from August and by 375,000 from a year earlier, but remain well below the 2021-2022 peak, when the rate reached 3.0% and more than 4.4 million people quit in a single month. For every layoff there were 2.05 quits, computed by RemoteLaws (BLS JOLTS, November 3, 2026 release).

By the RemoteLaws Research Team · Published November 22, 2026 · Latest data: September 2026 (preliminary) · Next update: December 1, 2026 (October data)
Key Quits Statistics (Latest BLS Data)
- 3.365 million quits in September 2026 (preliminary, seasonally adjusted), a 2.1% quits rate. Source: BLS JOLTS, November 3, 2026 release, Table 4.
- +321,000 from August 2026 (3.044 million) and +375,000 from September 2025 (2.990 million). Source: BLS JOLTS, Table 4 and release text.
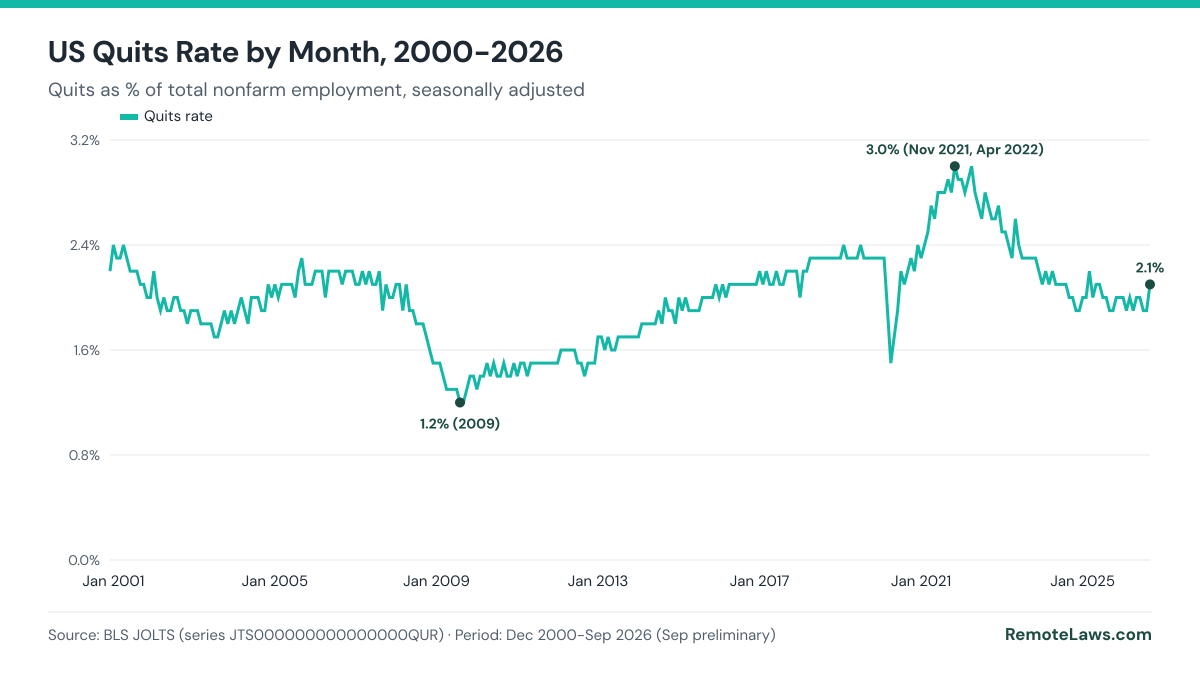
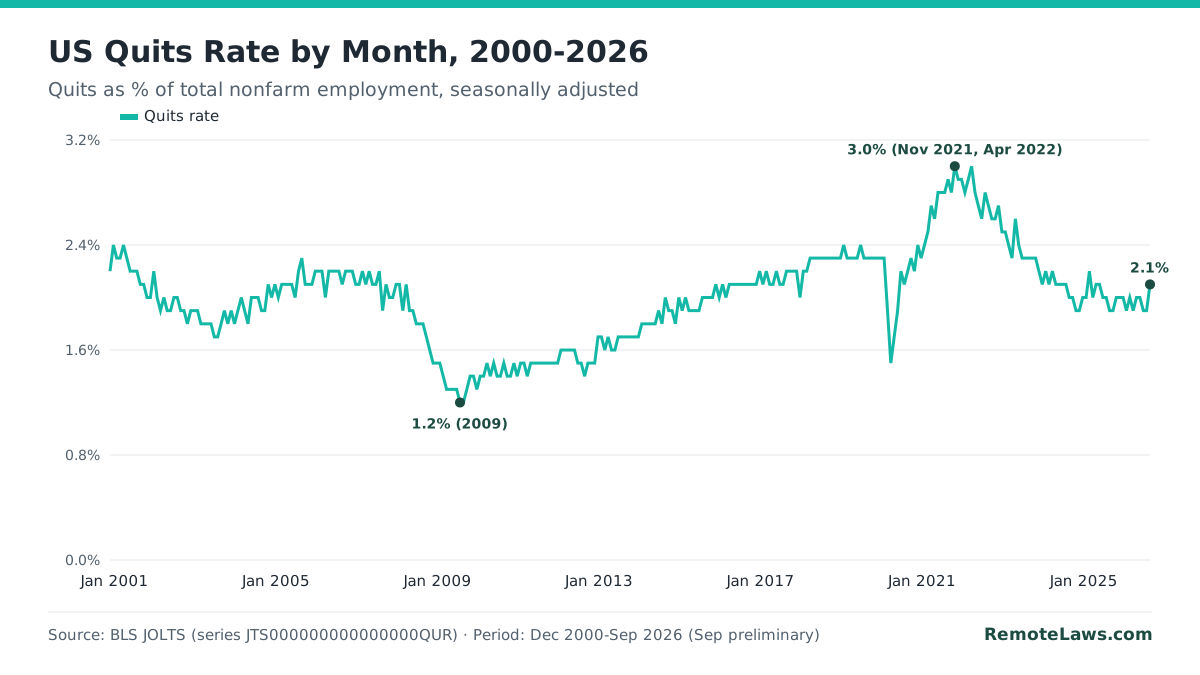
- Record quits rate: 3.0% in November 2021 and April 2022. Record monthly quits: 4.499 million in April 2022. Lowest rate: 1.2% in August and September 2009. Source: BLS series JTS000000000000000QUR and QUL, December 2000 to September 2026.
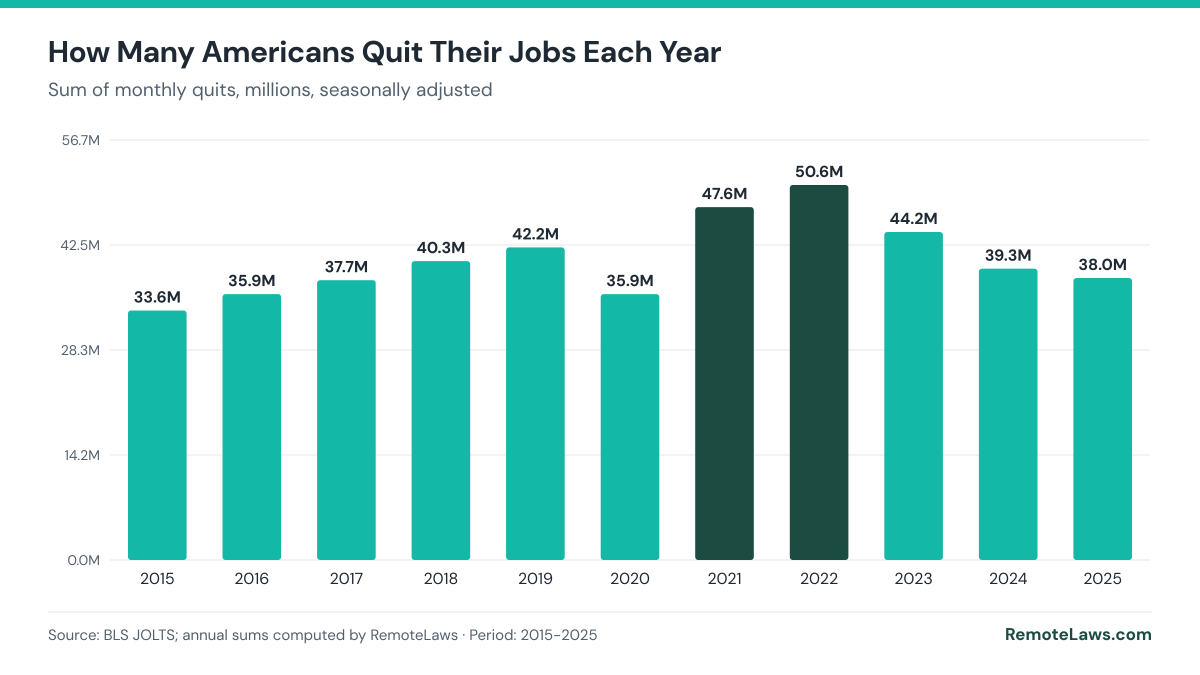
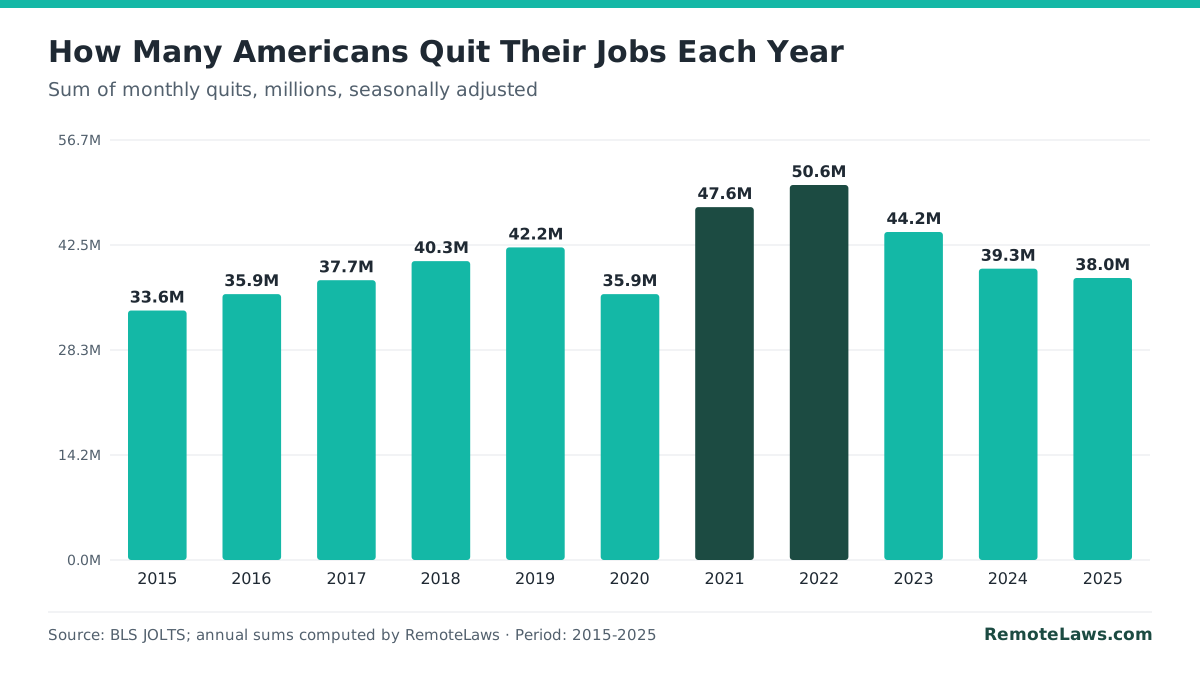
- 50.6 million quits in 2022 and 47.6 million in 2021, the two highest years on record, versus 38.0 million in 2025. Sums of seasonally adjusted monthly quits computed by RemoteLaws.
- The September 2026 rate of 2.1% is close to the 2001-2019 average of 1.9%. Computed by RemoteLaws.
- 2.05 quits per layoff in September 2026 (3.365 million quits, 1.641 million layoffs and discharges), down from a record 3.43 in April 2022. Computed by RemoteLaws from BLS JOLTS.
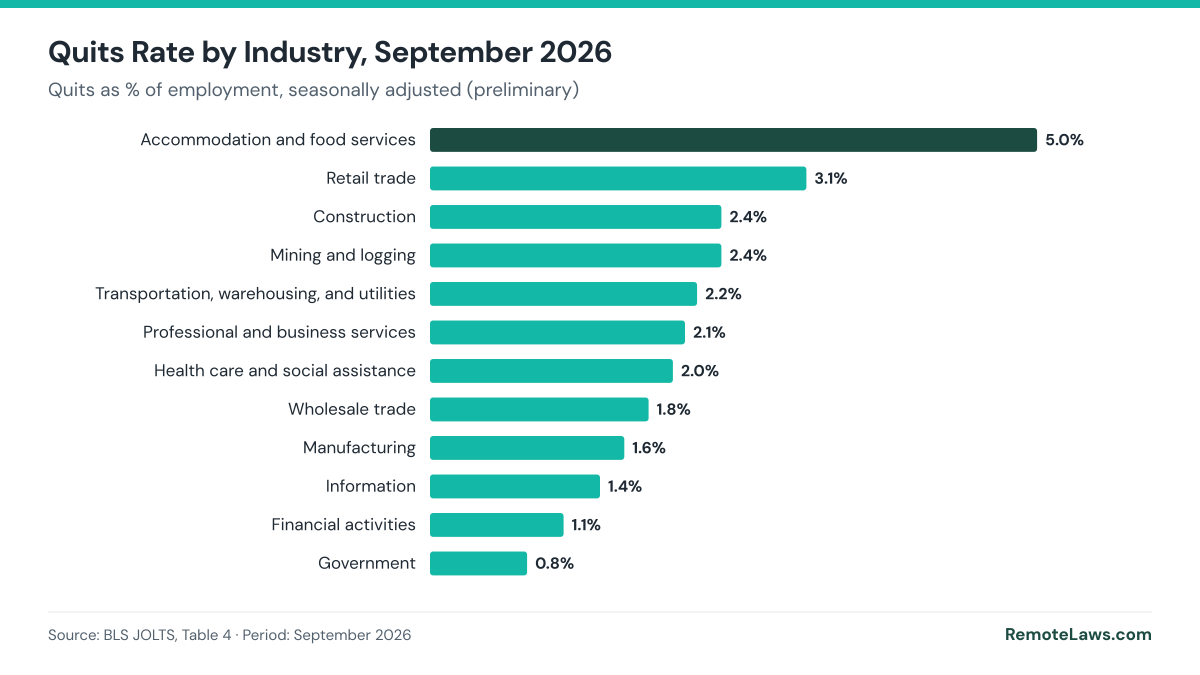
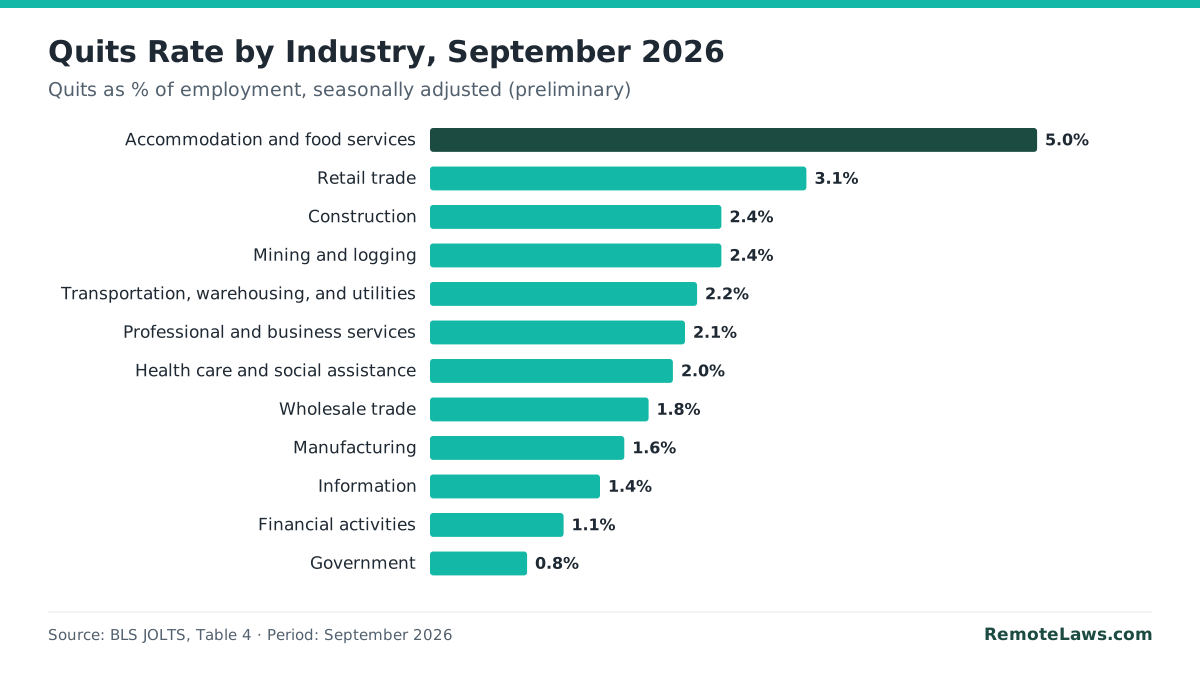
- Accommodation and food services had the highest quits rate (5.0%) and the most quits (719,000) in September 2026; government had the lowest rate (0.8%). Source: BLS JOLTS Table 4.
- By region, the South had the highest quits rate (2.5%) and the Northeast the lowest (1.7%) in September 2026. Source: BLS JOLTS Table 4.
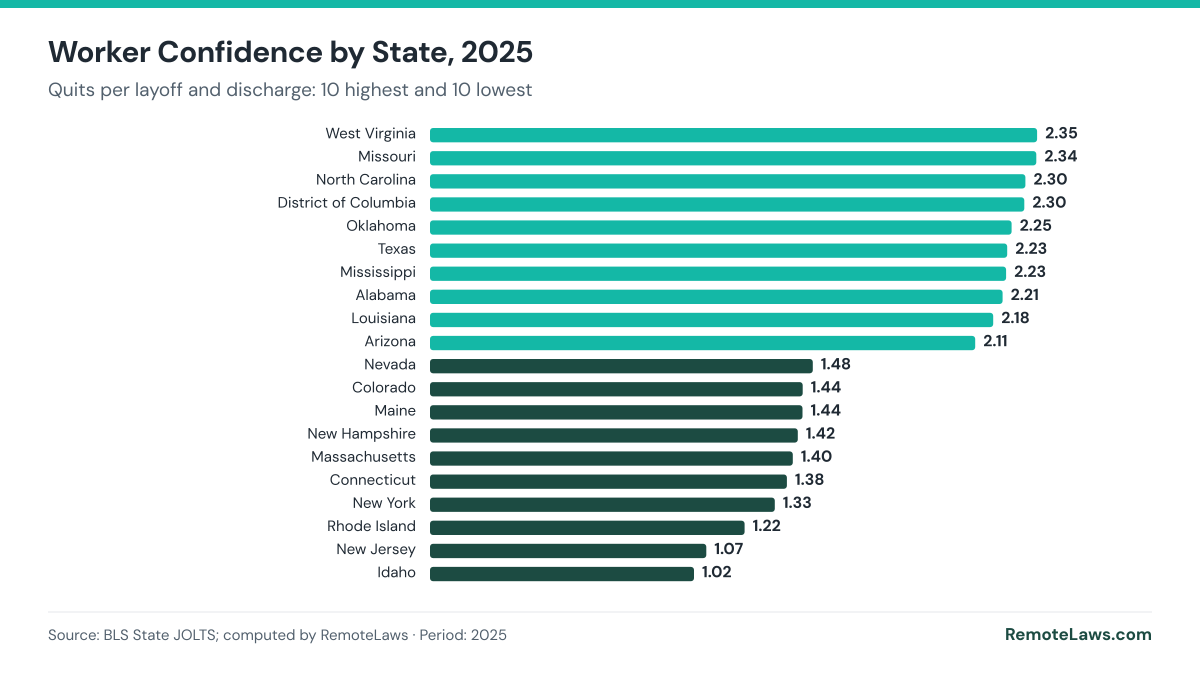
- In 2025, Alaska had the highest average quits rate (2.7%) and Massachusetts the lowest (1.4%); West Virginia had the most quits per layoff (2.35). Computed by RemoteLaws from BLS State JOLTS.
Monthly Quits Rate Since 2000
Cite this chart (APA, MLA, HTML) and embed code
APA: RemoteLaws. (2026, November 22). US Quits Rate by Month, December 2000 to September 2026 [Chart]. Data from BLS JOLTS. https://remotelaws.com/statistics/quits-rate/
MLA: “US Quits Rate by Month, December 2000 to September 2026.” RemoteLaws, 22 Nov. 2026, https://remotelaws.com/statistics/quits-rate/. Chart; data from BLS JOLTS.
HTML link with attribution:
Embed this chart:
The quits rate measures voluntary separations initiated by employees as a share of total employment. Because people rarely quit without another job or a strong labor market, economists read it as a measure of worker confidence. It fell to 1.2% in 2009, recovered to about 2.3% in 2018-2019, collapsed in spring 2020, then hit 3.0% in late 2021 and early 2022. Since 2024 it has moved between 1.9% and 2.2%.
| Month | Quits | Quits rate | Layoffs and discharges | Layoffs rate | Quits per layoff* |
|---|---|---|---|---|---|
| Sep 2026 (p) | 3,365 | 2.1% | 1,641 | 1.0% | 2.05 |
| Aug 2026 | 3,044 | 1.9% | 1,768 | 1.1% | 1.72 |
| Jul 2026 | 3,089 | 1.9% | 1,702 | 1.1% | 1.81 |
| Jun 2026 | 3,213 | 2.0% | 1,785 | 1.1% | 1.80 |
| May 2026 | 3,153 | 2.0% | 1,761 | 1.1% | 1.79 |
| Apr 2026 | 3,043 | 1.9% | 1,667 | 1.0% | 1.83 |
| Mar 2026 | 3,160 | 2.0% | 1,884 | 1.2% | 1.68 |
| Feb 2026 | 3,046 | 1.9% | 1,714 | 1.1% | 1.78 |
| Jan 2026 | 3,131 | 2.0% | 1,660 | 1.0% | 1.89 |
| Dec 2025 | 3,225 | 2.0% | 1,666 | 1.1% | 1.94 |
| Nov 2025 | 3,119 | 2.0% | 1,660 | 1.0% | 1.88 |
| Oct 2025 | 2,980 | 1.9% | 1,891 | 1.2% | 1.58 |
| Sep 2025 | 2,990 | 1.9% | 1,816 | 1.1% | 1.65 |
(p) Preliminary. *Computed by RemoteLaws. Source: BLS JOLTS. The August 2026 quits figure was revised down by 22,000 in the November 3 release.
The Great Resignation in Numbers
Cite this chart (APA, MLA, HTML) and embed code
APA: RemoteLaws. (2026, November 22). Quits per Year in the US, 2015 to 2025 [Chart]. Data from BLS JOLTS, computed by RemoteLaws. https://remotelaws.com/statistics/quits-rate/
MLA: “Quits per Year in the US, 2015 to 2025.” RemoteLaws, 22 Nov. 2026, https://remotelaws.com/statistics/quits-rate/. Chart; data from BLS JOLTS, computed by RemoteLaws.
HTML link with attribution:
Embed this chart:
| Year | Quits (millions) | Change from prior year |
|---|---|---|
| 2018 | 40.3 | +2.6M |
| 2019 | 42.2 | +1.8M |
| 2020 | 35.9 | −6.3M |
| 2021 | 47.6 | +11.7M |
| 2022 | 50.6 | +3.0M |
| 2023 | 44.2 | −6.3M |
| 2024 | 39.3 | −5.0M |
| 2025 | 38.0 | −1.3M |
“Great Resignation” is the name commonly given to the wave of quits in 2021 and 2022. JOLTS shows 47.6 million quits in 2021 and 50.6 million in 2022, compared with 42.2 million in 2019. Quits then fell for three straight years, to 38.0 million in 2025. The data show how many people quit, not why.
Annual totals are sums of monthly seasonally adjusted estimates and can differ slightly from BLS annual figures based on unadjusted data.
Quits vs. Layoffs: Who Ends the Job?
Cite this chart (APA, MLA, HTML) and embed code
APA: RemoteLaws. (2026, November 22). Quits per Layoff in the US, 2001 to 2026 [Chart]. Data from BLS JOLTS, computed by RemoteLaws. https://remotelaws.com/statistics/quits-rate/
MLA: “Quits per Layoff in the US, 2001 to 2026.” RemoteLaws, 22 Nov. 2026, https://remotelaws.com/statistics/quits-rate/. Chart; data from BLS JOLTS, computed by RemoteLaws.
HTML link with attribution:
Embed this chart:
JOLTS splits separations into quits (employee choice), layoffs and discharges (employer choice) and other separations (retirement, death, transfers). Dividing quits by layoffs gives a simple balance: above 2, workers leave by choice twice as often as they are let go. The ratio was 2.05 in September 2026. For layoff trends by state, see our layoff statistics and Layoff Pressure Index.
Quits by Industry and Region, September 2026
Cite this chart (APA, MLA, HTML) and embed code
APA: RemoteLaws. (2026, November 22). Quits Rate by Industry, September 2026 [Chart]. Data from BLS JOLTS Table 4. https://remotelaws.com/statistics/quits-rate/
MLA: “Quits Rate by Industry, September 2026.” RemoteLaws, 22 Nov. 2026, https://remotelaws.com/statistics/quits-rate/. Chart; data from BLS JOLTS Table 4.
HTML link with attribution:
Embed this chart:
| Industry | Quits (thousands) | Quits rate |
|---|---|---|
| Accommodation and food services | 719 | 5.0% |
| Health care and social assistance | 479 | 2.0% |
| Retail trade | 475 | 3.1% |
| Professional and business services | 463 | 2.1% |
| Manufacturing | 199 | 1.6% |
| Construction | 198 | 2.4% |
| Government | 178 | 0.8% |
| Transportation, warehousing, and utilities | 159 | 2.2% |
| Wholesale trade | 111 | 1.8% |
| Financial activities | 97 | 1.1% |
| Information | 39 | 1.4% |
| Mining and logging | 14 | 2.4% |
| Region | Quits (thousands) | Quits rate | Change from August |
|---|---|---|---|
| South | 1,472 | 2.5% | +46,000 |
| Midwest | 731 | 2.2% | +48,000 |
| West | 688 | 1.9% | +195,000 |
| Northeast | 474 | 1.7% | +32,000 |
Source: BLS JOLTS, November 3, 2026 release, Table 4. The quits rate is quits during the month as a percent of employment.
Quits by State: The RemoteLaws Worker Confidence Ranking
The RemoteLaws Worker Confidence Ratio divides each state’s 2025 quits by its layoffs and discharges. The table also shows the average quits rate in 2025, 2022 (the Great Resignation peak year) and 2019. State estimates are the latest BLS state figures, which run through December 2025.
Cite this chart (APA, MLA, HTML) and embed code
APA: RemoteLaws. (2026, November 22). Quits per Layoff by State, 2025 [Chart]. Data from BLS State JOLTS, computed by RemoteLaws. https://remotelaws.com/statistics/quits-rate/
MLA: “Quits per Layoff by State, 2025.” RemoteLaws, 22 Nov. 2026, https://remotelaws.com/statistics/quits-rate/. Chart; data from BLS State JOLTS, computed by RemoteLaws.
HTML link with attribution:
Embed this chart:
| Rank | State | Quits per layoff* | Quits 2025* | Layoffs 2025* | Quits rate 2025* | 2022* | 2019* |
|---|---|---|---|---|---|---|---|
| 1 | West Virginia | 2.35 | 197,000 | 84,000 | 2.3% | 3.5% | 2.8% |
| 2 | Missouri | 2.34 | 733,000 | 313,000 | 2.1% | 2.6% | 2.3% |
| 3 | North Carolina | 2.30 | 1,334,000 | 580,000 | 2.2% | 3.1% | 3.0% |
| 4 | District of Columbia | 2.30 | 163,000 | 71,000 | 1.8% | 2.2% | 1.7% |
| 5 | Oklahoma | 2.25 | 483,000 | 215,000 | 2.2% | 3.2% | 2.9% |
| 6 | Texas | 2.23 | 3,730,000 | 1,673,000 | 2.2% | 3.1% | 2.7% |
| 7 | Mississippi | 2.23 | 336,000 | 151,000 | 2.3% | 3.5% | 2.7% |
| 8 | Alabama | 2.21 | 533,000 | 241,000 | 2.0% | 3.2% | 2.4% |
| 9 | Louisiana | 2.18 | 570,000 | 262,000 | 2.4% | 3.3% | 3.0% |
| 10 | Arizona | 2.11 | 815,000 | 387,000 | 2.1% | 3.4% | 2.8% |
| 11 | Delaware | 2.09 | 134,000 | 64,000 | 2.2% | 3.5% | 2.8% |
| 12 | Oregon | 2.08 | 486,000 | 234,000 | 2.1% | 2.9% | 2.8% |
| 13 | South Carolina | 2.06 | 671,000 | 325,000 | 2.3% | 3.4% | 2.9% |
| 14 | South Dakota | 2.05 | 133,000 | 65,000 | 2.3% | 2.7% | 2.4% |
| 15 | Minnesota | 2.03 | 656,000 | 323,000 | 1.8% | 2.5% | 2.0% |
| 16 | Hawaii | 2.03 | 144,000 | 71,000 | 1.9% | 2.4% | 2.5% |
| 17 | Kansas | 2.02 | 373,000 | 185,000 | 2.1% | 2.6% | 2.4% |
| 18 | Maryland | 2.01 | 616,000 | 306,000 | 1.8% | 2.8% | 2.3% |
| 19 | Wyoming | 2.00 | 88,000 | 44,000 | 2.5% | 3.7% | 3.4% |
| 20 | Nebraska | 1.98 | 262,000 | 132,000 | 2.1% | 2.4% | 2.3% |
| 21 | Arkansas | 1.98 | 331,000 | 167,000 | 2.1% | 3.2% | 2.7% |
| 22 | Alaska | 1.98 | 109,000 | 55,000 | 2.7% | 4.3% | 3.9% |
| 23 | Ohio | 1.96 | 1,556,000 | 793,000 | 2.3% | 2.5% | 2.4% |
| 24 | Georgia | 1.94 | 1,184,000 | 611,000 | 2.0% | 3.9% | 2.6% |
| 25 | Tennessee | 1.93 | 965,000 | 500,000 | 2.4% | 3.5% | 2.6% |
| 26 | Wisconsin | 1.93 | 708,000 | 367,000 | 1.9% | 2.5% | 2.2% |
| 27 | Florida | 1.91 | 2,648,000 | 1,390,000 | 2.2% | 3.2% | 2.4% |
| 28 | Utah | 1.90 | 468,000 | 246,000 | 2.2% | 3.1% | 3.0% |
| 29 | Iowa | 1.90 | 378,000 | 199,000 | 2.0% | 2.7% | 2.2% |
| 30 | Virginia | 1.88 | 1,049,000 | 558,000 | 2.1% | 2.7% | 2.3% |
| 31 | New Mexico | 1.87 | 209,000 | 112,000 | 1.9% | 2.8% | 2.8% |
| 32 | Michigan | 1.86 | 1,230,000 | 661,000 | 2.3% | 2.5% | 2.4% |
| 33 | Indiana | 1.81 | 1,047,000 | 577,000 | 2.7% | 3.0% | 2.7% |
| 34 | North Dakota | 1.81 | 125,000 | 69,000 | 2.3% | 2.8% | 2.7% |
| 35 | Kentucky | 1.78 | 494,000 | 277,000 | 2.0% | 3.3% | 2.5% |
| 36 | Washington | 1.75 | 702,000 | 402,000 | 1.6% | 2.5% | 2.1% |
| 37 | Pennsylvania | 1.70 | 1,196,000 | 704,000 | 1.6% | 2.2% | 1.8% |
| 38 | Montana | 1.66 | 166,000 | 100,000 | 2.7% | 3.9% | 3.1% |
| 39 | Illinois | 1.65 | 1,491,000 | 906,000 | 2.0% | 2.4% | 2.1% |
| 40 | Vermont | 1.63 | 75,000 | 46,000 | 2.0% | 2.7% | 2.2% |
| 41 | California | 1.61 | 3,912,000 | 2,436,000 | 1.8% | 2.4% | 2.1% |
| 42 | Nevada | 1.48 | 380,000 | 257,000 | 2.0% | 3.0% | 2.7% |
| 43 | Colorado | 1.44 | 740,000 | 514,000 | 2.1% | 2.9% | 2.6% |
| 44 | Maine | 1.44 | 141,000 | 98,000 | 1.8% | 2.6% | 2.0% |
| 45 | New Hampshire | 1.42 | 152,000 | 107,000 | 1.8% | 2.6% | 1.9% |
| 46 | Massachusetts | 1.40 | 639,000 | 456,000 | 1.4% | 2.1% | 1.7% |
| 47 | Connecticut | 1.38 | 346,000 | 251,000 | 1.7% | 2.2% | 1.7% |
| 48 | New York | 1.33 | 1,991,000 | 1,495,000 | 1.7% | 1.9% | 1.5% |
| 49 | Rhode Island | 1.22 | 113,000 | 93,000 | 1.8% | 2.6% | 2.0% |
| 50 | New Jersey | 1.07 | 793,000 | 743,000 | 1.5% | 2.3% | 1.9% |
| 51 | Idaho | 1.02 | 259,000 | 254,000 | 2.5% | 3.4% | 3.0% |
*Computed by RemoteLaws from seasonally adjusted monthly BLS State JOLTS estimates (levels rounded to thousands by BLS, so small states are less precise). Idaho’s low ratio reflects a spike to 96,000 layoffs in December 2025. Source: BLS State JOLTS. Download the state CSV.
How Quits Are Measured
Quits come from the BLS Job Openings and Labor Turnover Survey, which asks about 21,000 establishments each month how many employees left voluntarily during the month. Retirements and transfers are not quits, and neither are layoffs, discharges or the end of temporary jobs. The quits rate divides quits by total employment. Figures are revised the following month and when seasonal factors are updated each year (BLS JOLTS).
Download the Data
Monthly US quits and layoffs, CSVState ranking 2025, CSV
CC BY 4.0.
How to Cite This Page and Reuse the Data
Free to use under CC BY 4.0. Journalists, researchers, bloggers and AI tools may quote any figure, ranking, index or chart on this page, including the indices computed by RemoteLaws, as long as they credit RemoteLaws with a link to this page. The underlying official data stay credited to their agencies.
Need a state breakdown, a custom chart or an expert comment? Contact the RemoteLaws Research Team.
APA: RemoteLaws Research Team. (2026, November 22). US Quits Rate 2026-2027: Monthly JOLTS Data, the Great Resignation and Every State Ranked. RemoteLaws. https://remotelaws.com/statistics/quits-rate/
MLA: RemoteLaws Research Team. “US Quits Rate 2026-2027: Monthly JOLTS Data, the Great Resignation and Every State Ranked.” RemoteLaws, 22 Nov. 2026, https://remotelaws.com/statistics/quits-rate/.
HTML link with attribution:
Frequently Asked Questions
What is the current US quits rate?
2.1% in September 2026, with 3.365 million quits, according to the preliminary BLS JOLTS estimate released November 3, 2026.
What was the highest quits rate on record?
3.0%, reached in November 2021 and again in April 2022. The highest monthly number of quits was 4.499 million in April 2022.
How many people quit their jobs in a year?
About 38.0 million in 2025, computed by RemoteLaws by adding monthly seasonally adjusted quits. The record was 50.6 million in 2022.
Is the Great Resignation over?
By the quits data, yes: the rate has been between 1.9% and 2.2% since 2024, close to its 2001-2019 average of 1.9%, compared with 2.6% to 3.0% from June 2021 through December 2022.
What is the difference between quits and layoffs?
Quits are separations the employee chooses. Layoffs and discharges are separations the employer initiates. In September 2026 there were 3.365 million quits and 1.641 million layoffs and discharges.
Which industry has the highest quits rate?
Accommodation and food services, at 5.0% in September 2026. Government had the lowest rate, 0.8%.
Which state has the highest quits rate?
Alaska, with an average quits rate of 2.7% in 2025, computed by RemoteLaws from BLS State JOLTS. Massachusetts had the lowest, 1.4%.
Why do economists watch the quits rate?
People usually quit when they expect to find another job, so a rising quits rate tends to signal a tight labor market and stronger wage growth, and a falling rate the opposite.
When is the next quits data release?
December 1, 2026, with October 2026 data, in the BLS JOLTS news release.
Sources, Methodology Notes & Update Log
- September 2026 figures and the August revision: BLS JOLTS, November 3, 2026 release, Tables 4 and 5, read November 22, 2026.
- Monthly series December 2000 to September 2026: JTS000000000000000QUR, QUL, LDL and LDR, read November 22, 2026.
- State estimates: BLS State JOLTS, latest month December 2025. Check: the 51 state quits totals for 2025 (38.05 million) match the national seasonally adjusted sum (38.04 million).
- Computed by RemoteLaws: annual sums, the 2001-2019 average, quits per layoff and the Worker Confidence Ratio.
- Update log: November 22, 2026, page created with September 2026 data.